Archive for the 'p.m.o' Category

Announcing git-cinnabar 0.5.0 beta 1

Git-cinnabar is a git remote helper to interact with mercurial repositories. It allows to clone, pull and push from/to mercurial remote repositories, using git.

Get it on github.

These release notes are also available on the git-cinnabar wiki.

What's new since 0.4.0?

  • git-cinnabar-helper is now mandatory. You can either download one with git cinnabar download on supported platforms or build one with make helper.
  • Metadata changes require to run git cinnabar fsck.
  • Mercurial tags are consolidated in a separate (fake) repository. See the README file.
  • Updated git to 2.13.0 for git-cinnabar-helper.
  • Improved memory consumption and performance.
  • Improved experimental support for pushing merges.
  • Experimental support for clonebundles.
  • Removed support for the .git/hgrc file for mercurial specific configuration.
  • Support any version of Git (was previously limited to 1.8.5 minimum)

2017-06-04 07:33:05+0900

cinnabar, p.m.o | No Comments »

git-cinnabar experimental features

Since version 0.4.0, git-cinnabar has a few hidden experimental features. Two of them are available in 0.4.0, and a third was recently added on the master branch.

The basic mechanism to enable experimental features is to set a preference in the git configuration with a comma-separated list of features to enable, or all, for all of them. That preference is cinnabar.experiments.

Any means to set a git configuration can be used. You can:

  • Add the following to .git/config:
    [cinnabar]
    experiments=feature
    
  • Or run the following command:
    $ git config cinnabar.experiments feature
    
  • Or only enable the feature temporarily for a given command:
    $ git -c cinnabar.experiments=feature command arguments
    

But what features are there?

wire

In order to talk to Mercurial repositories, git-cinnabar normally uses mercurial python modules. This experimental feature allows to access Mercurial repositories without using the mercurial python modules. It then relies on git-cinnabar-helper to connect to the repository through the mercurial wire protocol.

As of version 0.4.0, the feature is automatically enabled when Mercurial is not installed.

merge

Git-cinnabar currently doesn't allow to push merge commits. The main reason for this is that generating the correct mercurial data for those merges is tricky, and needs to be gotten right.

In version 0.4.0, enabling this feature allows to push merge commits as long as the parent commits are available on the mercurial repository. If they aren't, you need to first push them independently, and then push the merge.

On current master, that limitation doesn't exist anymore ; you can just push everything in one go.

The main caveat with this experimental support for pushing merges is that it currently doesn't handle the case where a file was moved on one of the branches the same way mercurial would (i.e. the information would be lost to mercurial users).

clonebundles

As of mercurial 3.6, Mercurial servers can opt-in to providing pre-generated bundles, which, when clients support it, takes CPU load off the server when a clone is performed. Good for servers, and usually good for clients too when they have a fast network connection, because downloading a pre-generated bundle is usually faster than waiting for the server to generate one.

As of a few days ago, the master branch of git-cinnabar supports cloning using those pre-generated bundles, provided the server advertizes them (mozilla-central does).

2017-04-02 07:54:58+0900

cinnabar, p.m.o | No Comments »

Progress on git-cinnabar memory usage

This all started when I figured out that git-cinnabar was using crazy amounts of memory when cloning mozilla-central. That pointed to memory allocation patterns that triggered a suboptimal behavior in the glibc memory allocator, and, while overall, git-cinnabar wasn't really abusing memory all things considered, it happened to be realloc()ating way too much.

It also turned out that recent changes on the master branch had made most uses of fast-import synchronous, making the whole process significantly slower.

This is where we started from on 0.4.0:

And on the master branch as of be75326:

An interesting thing to note here is that the glibc allocator runaway memory use was, this time, more pronounced on 0.4.0 than on master. It was the opposite originally, but as I mentioned in the past ASLR is making it not happen exactly the same way each time.

While I'm here, one thing I failed to mention in the previous posts is that all these measurements were done by cloning a local mercurial clone of mozilla-central, served from localhost via HTTP to eliminate the download time from hg.mozilla.org. And while mozilla-central itself has received new changesets since the first post, the local clone has not been updated, such that all subsequent clone tests I did were cloning the exact same repository under the exact same circumstances.

After last blog post, I focused on the low hanging fruits identified so far:

  • Moving the mercurial to git SHA1 mapping to the helper process (Finding a git bug in the process).
  • Tracking mercurial manifest heads in the helper process.
  • Removing most of the synchronous calls to the helper happening during a clone.

And this is how things now look on the master branch as of 35c18e7:

So where does that put us?

  • The overall clone is now about 11 minutes faster than 0.4.0 (and about 50 minutes faster than master as of be75326!)
  • Non-shared memory use of the git-remote-hg process stays well under 2GB during the whole clone, with no spike at the end.
  • git-cinnabar-helper now uses more memory, but the sum of both processes is less than what it used to be, even when compensating for the glibc memory allocator issue. One thing to note is that while the git-cinnabar-helper memory use goes above 2GB at the end of the clone, a very large part is due to the pack window size being 1GB on 64-bits (vs. 32MB on 32-bits). Memory usage should stay well under the 2GB address space limit on a 32-bits system.
  • CPU usage is well above 100% for most of the clone.

On a more granular level:

  • The "Import manifests" phase is now 13 minutes faster than it was in 0.4.0.
  • The "Read and import files" phase is still almost 4 minutes slower than in 0.4.0.
  • The "Import changesets" phase is still almost 2 minutes slower than in 0.4.0.
  • But the "Finalization" phase is now 3 minutes faster than in 0.4.0.

What this means is that there's still room for improvement. But at this point, I'd rather focus on other things.

Logging all the memory allocations with the python allocator disabled still resulted in a 6.5GB compressed log file, containing 2.6 billion calls to malloc, calloc, free and realloc (down from 2.7 billions in be75326). The number of allocator calls done by the git-remote-hg process is down to 2.25 billions (from 2.34 billion in be75326).

Surprisingly, while more things were moved to the helper, it still made less allocations than in be75326: 345 millions, down from 363 millions. Presumably, this is because the number of commands processed by the fast-import code was reduced.

Let's now take a look at the various metrics we analyzed previously (the horizontal axis represents the number of allocator calls that happened before the measurement):

A few observations to make here:

  • The allocated memory (requested bytes) is well below what it was, and the spike at the end is entirely gone. It also more closely follows the amount of raw data we're holding on to (which makes sense since most of the bookkeeping was moved to the helper)
  • The number of live allocations (allocated memory pointers that haven't been free()d yet) has gone significantly down as well.
  • The cumulated[*] bytes are now in a much more reasonable range, with the lower bound close to the total amount of data we're dealing with during the clone, and the upper bound slightly over twice that amount (the upper bound for the be75326 is not shown here, but it was around 45TB; less than 7TB is a big improvement).
  • There are less allocator calls during the first phases and the "Importing changesets" phase, but more during the "Reading and importing files" and "Importing manifests" phases.

[*] The upper bound is the sum of all sizes ever given to malloc, calloc, realloc etc. and the lower bound is the same, but removing the size of allocations passed as input to realloc (in practical words, this pretends reallocs never happened and that the final size for a given reallocated pointer is the one that counts)

So presumably, some of the changes led to more short-lived allocations. Considering python uses its own allocator for sizes smaller than 512 bytes, it's probably not so much of a problem. But let's look at the distribution of buffer sizes (including all sizes given to realloc).

(Bucket size is 16 bytes)

What is not completely obvious from the logarithmic scale is that, in fact, 98.4% of the allocations are less than 512 bytes with the current master (35c18e7), and they were 95.5% with be75326. Interestingly, though, in absolute numbers, there are less allocations smaller than 512 bytes in current master than in be75326 (1,194,268,071 vs 1,214,784,494). This suggests the extra allocations that happen during some phases are larger than that.

There are clearly less allocations across the board (apart from very few exceptions), and close to an order of magnitude less allocations larger than 1MiB. In fact, widening the bucket size to 32KiB shows an order of magnitude difference (or close) for most buckets:

An interesting thing to note is how some sizes are largely overrepresented in the data with buckets of 16 bytes, like 768, 1104, 2048, 4128, with other smaller bumps for e.g. 2144, 2464, 2832, 3232, 3696, 4208, 4786, 5424, 6144, 6992, 7920... While some of those are powers of 2, most aren't, and some of them may actually represent objects sized with a power of 2, but that have an extra PyObject overhead.

While looking at allocation stats, I got to wonder what the lifetimes of those allocations looked like. So I scanned the allocator logs and measured the distance between when an allocation is made and when it is freed, ignoring reallocs.

To give a few examples of what I mean, the following allocation for p gets a lifetime of 0:

void *p = malloc(42);
free(p);

The following a lifetime of 1:

void *p = malloc(42);
void *other = malloc(42);
free(p);

And the following a lifetime of 1 as well:

void *p = malloc(42);
p = realloc(p, 84);
free(p);

(that is, it is not counted as two malloc/free pairs)

The further away the free is from the corresponding malloc, the larger the lifetime. And the largest the lifetime can ever be is the total number of allocator function calls minus two, in the hypothetical case the very first allocation is freed as the very last (minus two because we defined the lifetime as the distance).

What comes out of this data:

  • As expected, there are more short-lived allocations in 35c18e7.
  • Around 90% of allocations have a lifetime spanning 10% of the process life or less. This is a rather surprisingly large amount of allocations with a very large lifetime.
  • Around 80% of allocations have a lifetime spanning 0.01% of the process life or less.
  • The median lifetime is around 0.0000002% (2*10-7%) of the process life, which, in absolute terms is around 500 allocator function calls between a malloc and a free.
  • If we consider every imported changeset, manifest and file to require a similar number of allocations, and considering there are about 2.7M of them in total, each spans about 3.7*10-7%. About 53% of all allocations on be75326 and 57% on 35c18e7 have a lifetime below that. Whenever I get to look more closely to memory usage again, I'll probably look at the data separately for each individual phase.
  • One surprising fact, that doesn't appear on the graph because of the logarithmic scale not showing "0" on the horizontal axis, is that 9.3% on be75326 and 7.3% on 35c18e7 of all allocations have a lifetime of 0. That is, whatever the code using them is doing, it's not allocating or freeing anything else, and not reallocating them either.

All in all, what the data shows is that we're definitely in a better place now than we used to be a few days ago, and that there is still work to do on the memory front, but:

  • As mentioned in a previous post, there are bigger wins to be had from not keeping manifests data around in memory at all, and by importing it directly instead.
  • In time, a lot of the import code is meant to move to the helper, where the constraints are completely different, and it might not be worth spending time now on reducing the memory usage of python code that might go away soon(ish). The situation was bad and necessitated action rather quickly, but we're now in a place where it's not as bad anymore.

So at this point, I won't look any deeper into the memory usage of the git-remote-hg python process, and will instead focus on the planned metadata storage changes. They will allow to share the metadata more easily (allowing faster and more straightforward gecko-dev graft), and will allow to import manifests earlier, which, as mentioned already, will help reduce memory use, but, more importantly, will allow to do more actual work while downloading the data. On slow networks, this is crucial to make clones and pulls faster.

2017-04-01 18:45:19+0900

cinnabar, p.m.o | No Comments »

Why is the git-cinnabar master branch slower to clone?

Apart from the memory considerations, one thing that the data presented in the "When the memory allocator works against you" post that I haven't touched in the followup posts is that there is a large difference in the time it takes to clone mozilla-central with git-cinnabar 0.4.0 vs. the master branch.

One thing that was mentioned in the first followup is that reducing the amount of realloc and substring copies made the cloning more than 15 minutes faster on master. But the same code exists in 0.4.0, so this isn't part of the difference.

So what's going on? Looking at the CPU usage during the clone is enlightening.

On 0.4.0:

On master:

(Note: the data gathering is flawed in some ways, which explains why the git-remote-hg process goes above 100%, which is not possible for this python process. The data is however good enough for the high level analysis that follows, so I didn't bother to get something more acurate)

On 0.4.0, the git-cinnabar-helper process was saturating one CPU core during the File import phase, and the git-remote-hg process was saturating one CPU core during the Manifest import phase. Overall, the sum of both processes usually used more than one and a half core.

On master, however, the total of both processes barely uses more than one CPU core.

What happened?

This and that happened.

Essentially, before those changes, git-remote-hg would send instructions to git-fast-import (technically, git-cinnabar-helper, but in this case it's only used as a wrapper for git-fast-import), and use marks to track the git objects that git-fast-import created.

After those changes, git-remote-hg asks git-fast-import the git object SHA1 of objects it just asked to be created. In other words, those changes replaced something asynchronous with something synchronous: while it used to be possible for git-remote-hg to work on the next file/manifest/changeset while git-fast-import was working on the previous one, it now waits.

The changes helped simplify the python code, but made the overall clone process much slower.

If I'm not mistaken, the only real use for that information is for the mapping of mercurial to git SHA1s, which is actually rarely used during the clone, except at the end, when storing it. So what I'm planning to do is to move that mapping to the git-cinnabar-helper process, which, incidentally, will kill not 2, but 3 birds with 1 stone:

  • It will restore the asynchronicity, obviously (at least, that's the expected main outcome).
  • Storing the mapping in the git-cinnabar-helper process is very likely to take less memory than what it currently takes in the git-remote-hg process. Even if it doesn't (which I doubt), that should still help stay under the 2GB limit of 32-bit processes.
  • The whole thing that spikes memory usage during the finalization phase, as seen in previous post, will just go away, because the git-cinnabar-helper process will just have prepared the git notes-like tree on its own.

So expect git-cinnabar 0.5 to get moar faster, and to use moar less memory.

2017-03-23 16:38:05+0900

cinnabar, p.m.o | No Comments »

Analyzing git-cinnabar memory use

In previous post, I was looking at the allocations git-cinnabar makes. While I had the data, I figured I'd also look how the memory use correlates with expectations based on repository data, to put things in perspective.

As a reminder, this is what the allocations look like (horizontal axis being the number of allocator function calls):

There are 7 different phases happening during a git clone using git-cinnabar, most of which can easily be identified on the graph above:

  • Negotiation.

    During this phase, git-cinnabar talks to the mercurial server to determine what needs to be pulled. Once that is done, a getbundle request is emitted, which response is read in the next three phases. This phase is essentially invisible on the graph.

  • Reading changeset data.

    The first thing that a mercurial server sends in the response for a getbundle request is changesets. They are sent in the RevChunk format. Translated to git, they become commit objects. But to create commit objects, we need the entire corresponding trees and files (blobs), which we don't have yet. So we keep this data in memory.

    In the git clone analyzed here, there are 345643 changesets loaded in memory. Their raw size in RawChunk format is 237MB. I think by the end of this phase, we made 20 million allocator calls, have about 300MB of live data in about 840k allocations. (No certainty because I don't actually have definite data that would allow to correlate between the phases and allocator calls, and the memory usage change between this phase and next is not as clear-cut as with other phases). This puts us at less than 3 live allocations per changeset, with "only" about 60MB overhead over the raw data.

  • Reading manifest data.

    In the stream we receive, manifests follow changesets. Each changeset points to one manifest ; several changesets can point to the same manifest. Manifests describe the content of the entire source code tree in a similar manner as git trees, except they are flat (there's one manifest for the entire tree, where git trees would reference other git trees for sub directories). And like git trees, they only map file paths to file SHA1s. The way they are currently stored by git-cinnabar (which is planned to change) requires knowing the corresponding git SHA1s for those files, and we haven't got those yet, so again, we keep everything in memory.

    In the git clone analyzed here, there are 345398 manifests loaded in memory. Their raw size in RawChunk format is 1.18GB. By the end of this phase, we made 23 million more allocator calls, and have about 1.52GB of live data in about 1.86M allocations. We're still at less than 3 live allocations for each object (changeset or manifest) we're keeping in memory, and barely over 100MB of overhead over the raw data, which, on average puts the overhead at 150 bytes per object.

    The three phases so far are relatively fast and account for a small part of the overall process, so they don't appear clear-cut to each other, and don't take much space on the graph.

  • Reading and Importing files.

    After the manifests, we finally get files data, grouped by path, such that we get all the file revisions of e.g. .cargo/.gitignore, followed by all the file revisions of .cargo/config.in, .clang-format, and so on. The data here doesn't depend on anything else, so we can finally directly import the data.

    This means that for each revision, we actually expand the RawChunk into the full file data (RawChunks contain patches against a previous revision), and don't keep the RawChunk around. We also don't keep the full data after it was sent to the git-cinnabar-helper process (as far as cloning is concerned, it's essentially a wrapper for git-fast-import), except for the previous revision of the file, which is likely the patch base for the next revision.

    We however keep in memory one or two things for each file revision: a mapping of its mercurial SHA1 and the corresponding git SHA1 of the imported data, and, when there is one, the file metadata (containing information about file copy/renames) that lives as a header in the file data in mercurial, but can't be stored in the corresponding git blobs, otherwise we'd have irrelevant data in checkouts.

    On the graph, this is where there is a steady and rather long increase of both live allocations and memory usage, in stairs for the latter.

    In the git clone analyzed here, there are 2.02M file revisions, 78k of which have copy/move metadata for a cumulated size of 8.5MB of metadata. The raw size of the file revisions in RawChunk format is 3.85GB. The expanded data size is 67GB. By the end of this phase, we made 622 million more allocator calls, and peaked at about 2.05GB of live data in about 6.9M allocations. Compared to the beginning of this phase, that added about 530MB in 5 million allocations.

    File metadata is stored in memory as python dicts, with 2 entries each, instead of raw form for convenience and future-proofing, so that would be at least 3 allocations each: one for each value, one for the dict, and maybe one for the dict storage ; their keys are all the same and are probably interned by python, so wouldn't count.

    As mentioned above, we store a mapping of mercurial to git SHA1s, so for each file that makes 2 allocations, 4.04M total. Plus the 230k or 310k from metadata. Let's say 4.45M total. We're short 550k allocations, but considering the numbers involved, it would take less than one allocation per file on average to go over this count.

    As for memory size, per this answer on stackoverflow, python strings have an overhead of 37 bytes, so each SHA1 (kept in hex form) will take 77 bytes (Note, that's partly why I didn't particularly care about storing them as binary form, that would only save 25%, not 50%). That's 311MB just for the SHA1s, to which the size of the mapping dict needs to be added. If it were a plain array of pointers to keys and values, it would take 2 * 8 bytes per file, or about 32MB. But that would be a hash table with no room for more items (By the way, I suspect the stairs that can be seen on the requested and in-use bytes is the hash table being realloc()ed). Plus at least 290 bytes per dict for each of the 78k metadata, which is an additional 22M. All in all, 530MB doesn't seem too much of a stretch.

  • Importing manifests.

    At this point, we're done receiving data from the server, so we begin by
    dropping objects related to the bundle we got from the server. On the graph, I assume this is the big dip that can be observed after the initial increase in memory use, bringing us down to 5.6 million allocations and 1.92GB.

    Now begins the most time consuming process, as far as mozilla-central is concerned: transforming the manifests into git trees, while also storing enough data to be able to reconstruct manifests later (which is required to be able to pull from the mercurial server after the clone).

    So for each manifest, we expand the RawChunk into the full manifest data, and generate new git trees from that. The latter is mostly performed by the git-cinnabar-helper process. Once we're done pushing data about a manifest to that process, we drop the corresponding data, except when we know it will be required later as the delta base for a subsequent RevChunk (which can happen in bundle2).

    As with file revisions, for each manifest, we keep track of the mapping of SHA1s between mercurial and git. We also keep a DAG of the manifests history (contrary to git trees, mercurial manifests track their ancestry ; files do too, but git-cinnabar doesn't actually keep track of that separately ; it just relies on the manifests data to infer file ancestry).

    On the graph, this is where the number of live allocations increases while both requested and in-use bytes decrease, noisily.

    By the end of this phase, we made about 1 billion more allocator calls. Requested allocations went down to 1.02GB, for close to 7 million live allocations. Compared to the end of the dip at the beginning of this phase, that added 1.4 million allocations, and released 900MB. By now, we expect everything from the "Reading manifests" phase to have been released, which means we allocated around 620MB (1.52GB - 900MB), for a total of 3.26M additional allocations (1.4M + 1.86M).

    We have a dict for the SHA1s mapping (345k * 77 * 2 for strings, plus the hash table with 345k items, so at least 60MB), and the DAG, which, now that I'm looking at memory usage, I figure has the one of the possibly worst structure, using 2 sets for each node (at least 232 bytes per set, that's at least 160MB, plus 2 hash tables with 345k items). I think 250MB for those data structures would be largely underestimated. It's not hard to imagine them taking 620MB, because really, that DAG implementation is awful. The number of allocations expected from them would be around 1.4M (4 * 345k), but I might be missing something. That's way less than the actual number, so it would be interesting to take a closer look, but not before doing something about the DAG itself.

    Fun fact: the amount of data we're dealing with in this phase (the expanded size of all the manifests) is close to 2.9TB (yes, terabytes). With about 4700 seconds spent on this phase on a real clone (less with the release branch), we're still handling more than 615MB per second.

  • Importing changesets.

    This is where we finally create the git commits corresponding to the mercurial changesets. For each changeset, we expand its RawChunk, find the git tree we created in the previous phase that corresponds to the associated manifest, and create a git commit for that tree, with the right date, author, and commit message. For data that appears in the mercurial changeset that can't be stored or doesn't make sense to store in the git commit (e.g. the manifest SHA1, the list of changed files[*], or some extra metadata like the source of rebases), we keep some metadata we'll store in git notes later on.

    [*] Fun fact: the list of changed files stored in mercurial changesets does not necessarily match the list of files in a `git diff` between the corresponding git commit and its parents, for essentially two reasons:

    • Old buggy versions of mercurial have generated erroneous lists that are now there forever (they are part of what makes the changeset SHA1).
    • Mercurial may create new revisions for files even when the file content is not modified, most notably during merges (but that also happened on non-merges due to, presumably, bugs).

    ... so we keep it verbatim.

    On the graph, this is where both requested and in-use bytes are only slightly increasing.

    By the end of this phase, we made about half a billion more allocator calls. Requested allocations went up to 1.06GB, for close to 7.7 million live allocations. Compared to the end of the previous phase, that added 700k allocations, and 400MB. By now, we expect everything from the "Reading changesets" phase to have been released (at least the raw data we kept there), which means we may have allocated at most around 700MB (400MB + 300MB), for a total of 1.5M additional allocations (700k + 840k).

    All these are extra data we keep for the next and final phase. It's hard to evaluate the exact size we'd expect here in memory, but if we divide by the number of changesets (345k), that's less than 5 allocations per changeset and less than 2KB per changeset, which is low enough not to raise eyebrows, at least for now.

  • Finalizing the clone.

    The final phase is where we actually go ahead storing the mappings between mercurial and git SHA1s (all 2.7M of them), the git notes where we store the data necessary to recreate mercurial changesets from git commits, and a cache for mercurial tags.

    On the graph, this is where the requested and in-use bytes, as well as the number of live allocations peak like crazy (up to 21M allocations for 2.27GB requested).

    This is very much unwanted, but easily explained with the current state of the code. The way the mappings between mercurial and git SHA1s are stored is via a tree similar to how git notes are stored. So for each mercurial SHA1, we have a file that points to the corresponding git SHA1 through git links for commits or directly for blobs (look at the output of git ls-tree -r refs/cinnabar/metadata^3 if you're curious about the details). If I remember correctly, it's faster if the tree is created with an ordered list of paths, so the code created a list of paths, and then sorted it to send commands to create the tree. The former creates a new str of length 42 and a tuple of 3 elements for each and every one of the 2.7M mappings. With the 37 bytes overhead by str instance and the 56 + 3 * 8 bytes per tuple, we have at least 429MB wasted. Creating the tree itself keeps the corresponding fast-import commands in a buffer, where each command is going to be a tuple of 2 elements: a pointer to a method, and a str of length between 90 and 93. That's at least another 440MB wasted.

    I already fixed the first half, but the second half still needs addressing.

Overall, except for the stupid spike during the final phase, the manifest DAG and the glibc allocator runaway memory use described in previous posts, there is nothing terribly bad with the git-cinnabar memory usage, all things considered. Mozilla-central is just big.

The spike is already half addressed, and work is under way for the glibc allocator runaway memory use. The manifest DAG, interestingly, is actually mostly useless. It's only used to track the heads of the DAG, and it's very much possible to track heads of a DAG without actually storing the entire DAG. In fact, that's what git-cinnabar already does for changeset heads... so we would only need to do the same for manifest heads.

One could argue that the 1.4GB of raw RevChunk data we're keeping in memory for later user could be kept on disk instead. I haven't done this so far because I didn't want to have to handle temporary files (and answer questions like "where to put them?", "what if there isn't enough disk space there?", "what if disk access is slow?", etc.). But the majority of this data is from manifests. I'm already planning changes in how git-cinnabar stores manifests data that will actually allow to import them directly, instead of keeping them in memory until files are imported. This would instantly remove 1.18GB of memory usage. The downside, however, is that this would be more CPU intensive: Importing changesets will require creating the corresponding git trees, and getting the stored manifest data. I think it's worth, though.

Finally, one thing that isn't obvious here, but that was found while analyzing why RSS would be going up despite memory usage going down, is that git-cinnabar is doing way too many reallocations and substring allocations.

So let's look at two metrics that hopefully will highlight the problem:

  • The cumulated amount of requested memory. That is, the sum of all sizes ever given to malloc, realloc, calloc, etc.
  • The compensated cumulated amount of requested memory (naming is hard). That is, the sum of all sizes ever given to malloc, calloc, etc. except realloc. For realloc, we only count the delta in size between what the size was before and after the realloc.

Assuming all the requested memory is filled at some point, the former gives us an upper bound to the amount of memory that is ever filled or copied (the amount that would be filled if no realloc was ever in-place), while the the latter gives us a lower bound (the amount that would be filled or copied if all reallocs were in-place).

Ideally, we'd want the upper and lower bounds to be close to each other (indicating few realloc calls), and the total amount at the end of the process to be as close as possible to the amount of data we're handling (which we've seen is around 3TB).

... and this is clearly bad. Like, really bad. But we already knew that from the previous post, although it's nice to put numbers on it. The lower bound is about twice the amount of data we're handling, and the upper bound is more than 10 times that amount. Clearly, we can do better.

We'll see how things evolve after the necessary code changes happen. Stay tuned.

2017-03-23 13:30:26+0900

cinnabar, p.m.o | No Comments »

When the memory allocator works against you, part 2

This is a followup to the "When the memory allocator works against you" post from a few days ago. You may want to read that one first if you haven't, and come back. In case you don't or didn't read it, it was all about memory consumption during a git clone of the mozilla-central mercurial repository using git-cinnabar, and how the glibc memory allocator is using more than one would expect. This post is going to explore how/why it's happening.

I happen to have written a basic memory allocation logger for Firefox, so I used it to log all the allocations happening during a git clone exhibiting the runaway memory increase behavior (using a python that doesn't use its own allocator for small allocations).

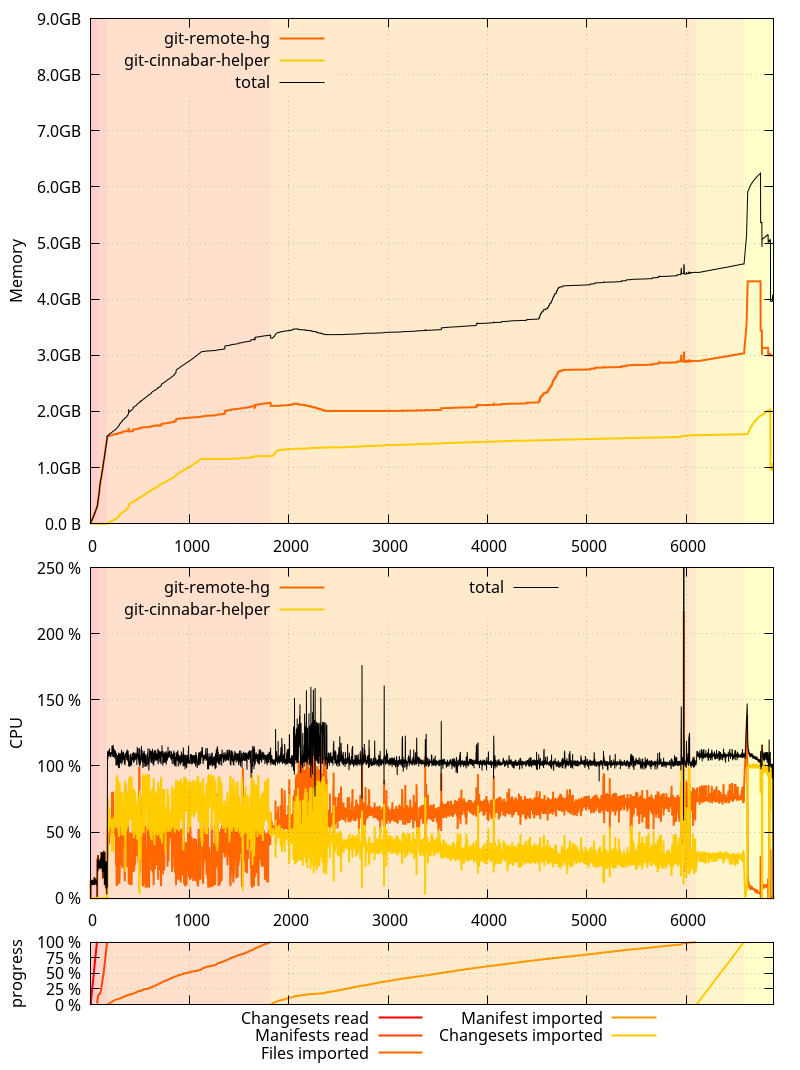
The result was a 6.5 GB log file (compressed with zstd ; 125 GB uncompressed!) with 2.7 billion calls to malloc, calloc, free, and realloc, recorded across (mostly) 2 processes (the python git-remote-hg process and the native git-cinnabar-helper process ; there are other short-lived processes involved, but they do less than 5000 calls in total).

The vast majority of those 2.7 billion calls is done by the python git-remote-hg process: 2.34 billion calls. We'll only focus on this process.

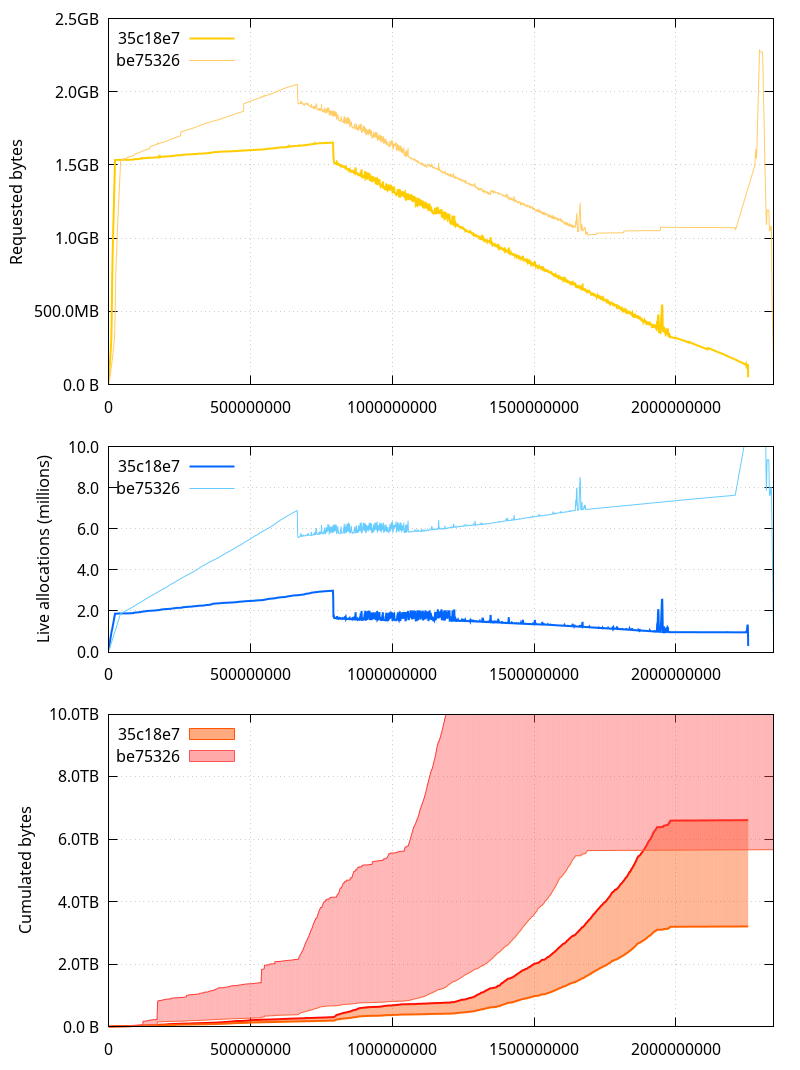
Replaying those 2.34 billion calls with a program that reads the log allowed to reproduce the runaway memory increase behavior to some extent. I went an extra mile and modified glibc's realloc code in memory so it doesn't call memcpy, to make things faster. I also ran under setarch x86_64 -R to disable ASLR for reproducible results (two consecutive runs return the exact same numbers, which doesn't happen with ASLR enabled).

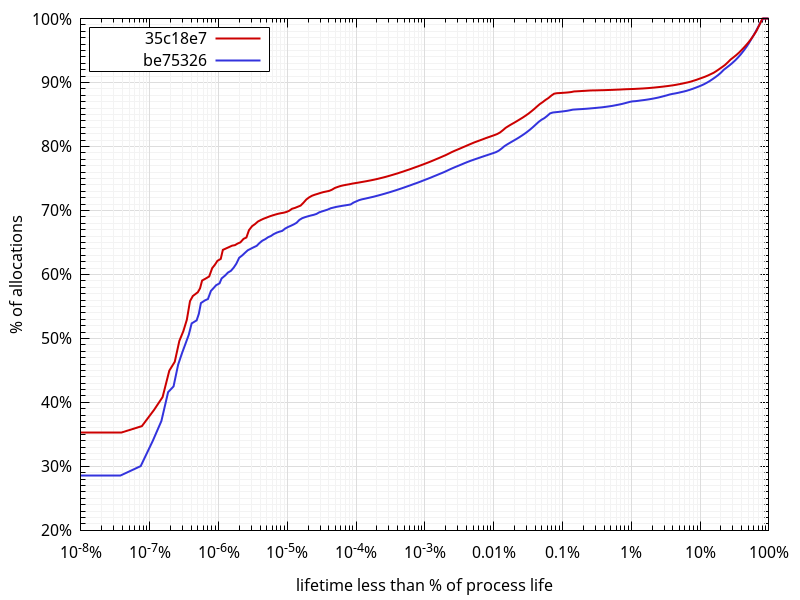
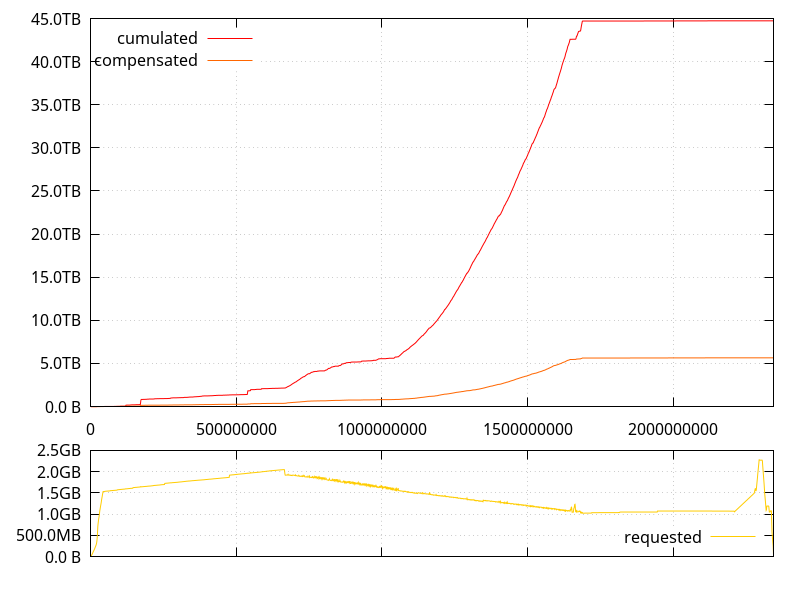
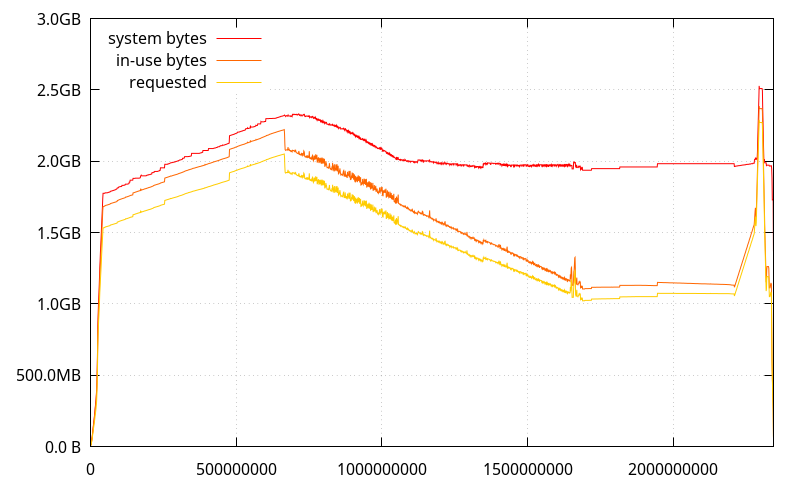
I also modified the program to report the number of live allocations (allocations that haven't been freed yet), and the cumulated size of the actually requested allocations (that is, the sum of all the sizes given to malloc, calloc, and realloc calls for live allocations, as opposed to what the memory allocator really allocated, which can be more, per malloc_usable_size).

RSS was not tracked because the allocations are never filled to make things faster, such that pages for large allocations are never dirty, and RSS doesn't grow as much because of that.

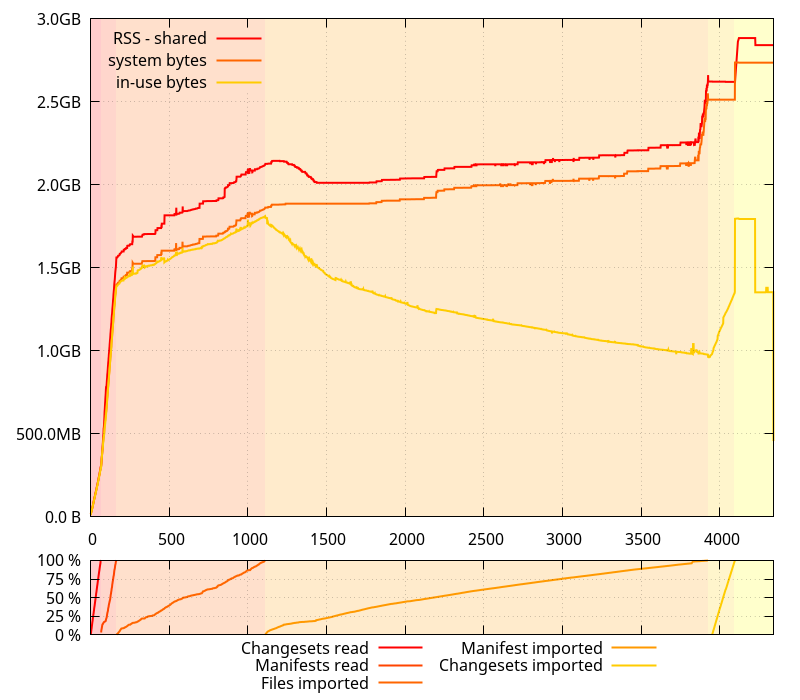
Full disclosure: it turns out the "system bytes" and "in-use bytes" numbers I had been collecting in the previous post were smaller than what they should have been, and were excluding memory that the glibc memory allocator would have mmap()ed. That however doesn't affect the trends that had been witnessed. The data below is corrected.

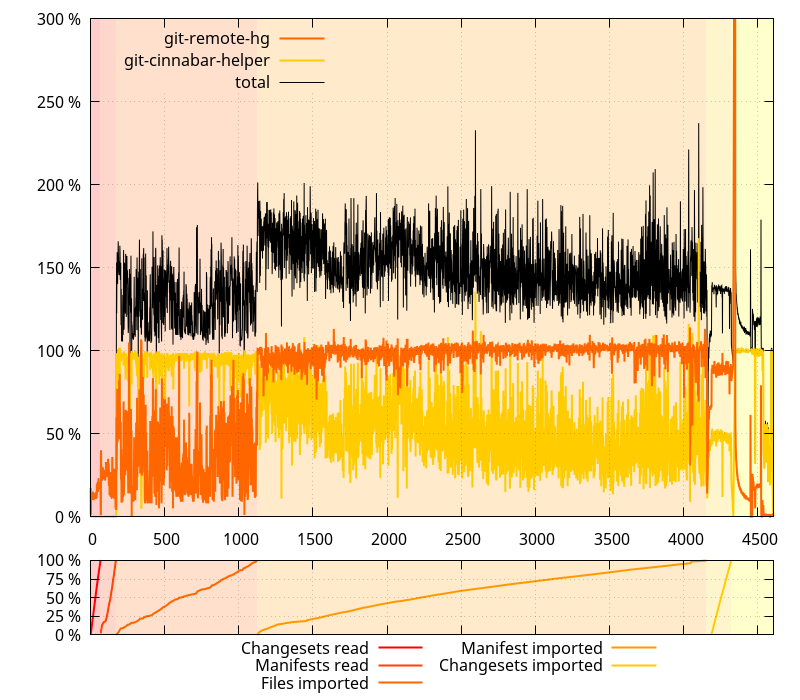
(Note that in the graph above and the graphs that follow, the horizontal axis represents the number of allocator function calls performed)

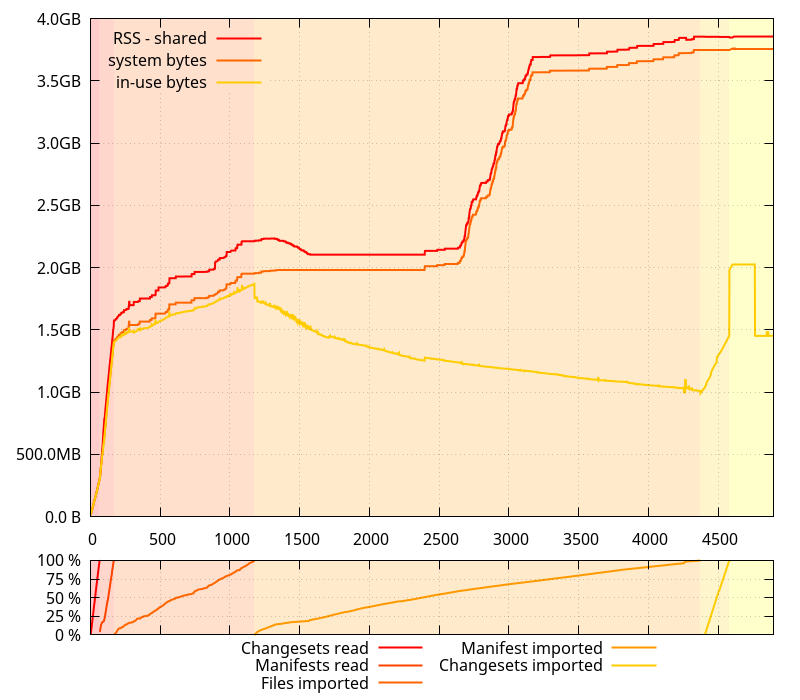
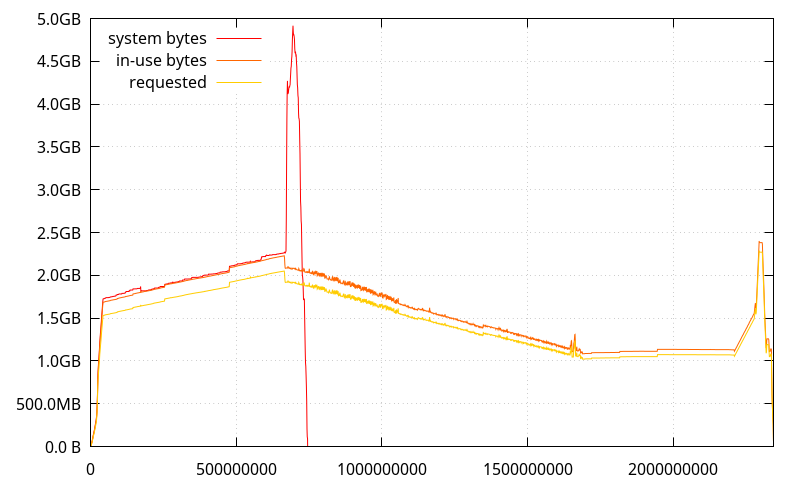
While I was here, I figured I'd check how mozjemalloc performs, and it has a better behavior (although it has more overhead).

What doesn't appear on this graph, though, is that mozjemalloc also tells the OS to drop some pages even if it keeps them mapped (madvise(MADV_DONTNEED)), so in practice, it is possible the actual RSS decreases too.
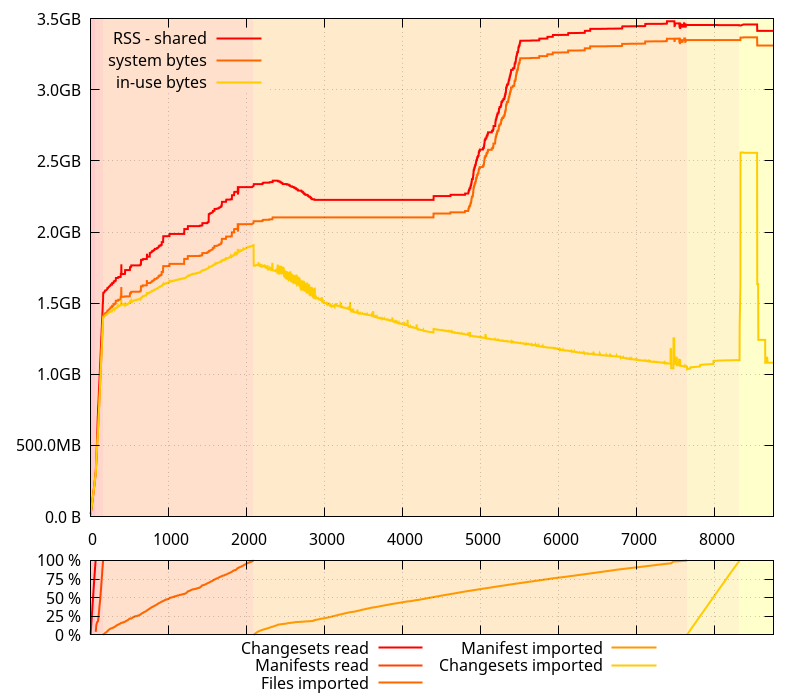
And jemalloc 4.5:

(It looks like it has better memory usage than mozjemalloc for this use case, but its stats are being thrown off at some point, I'll have to investigate)

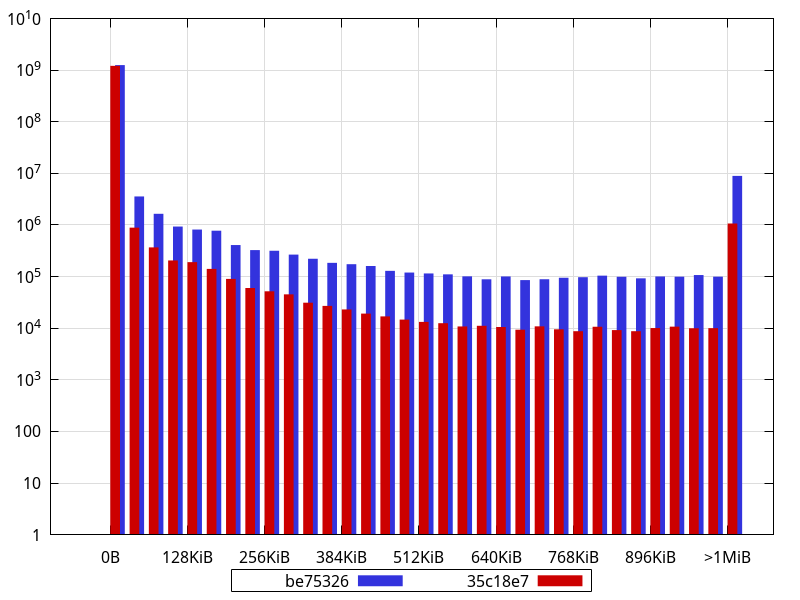
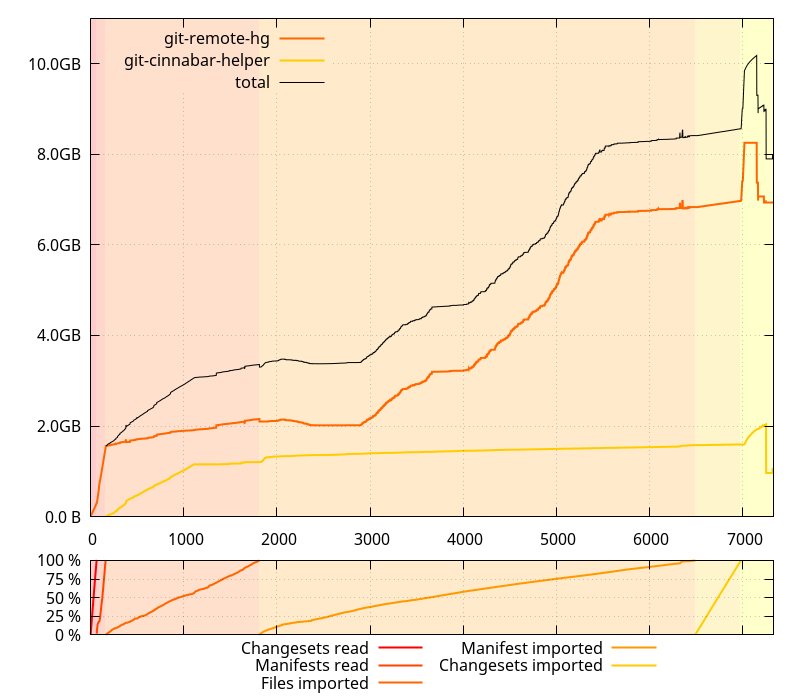
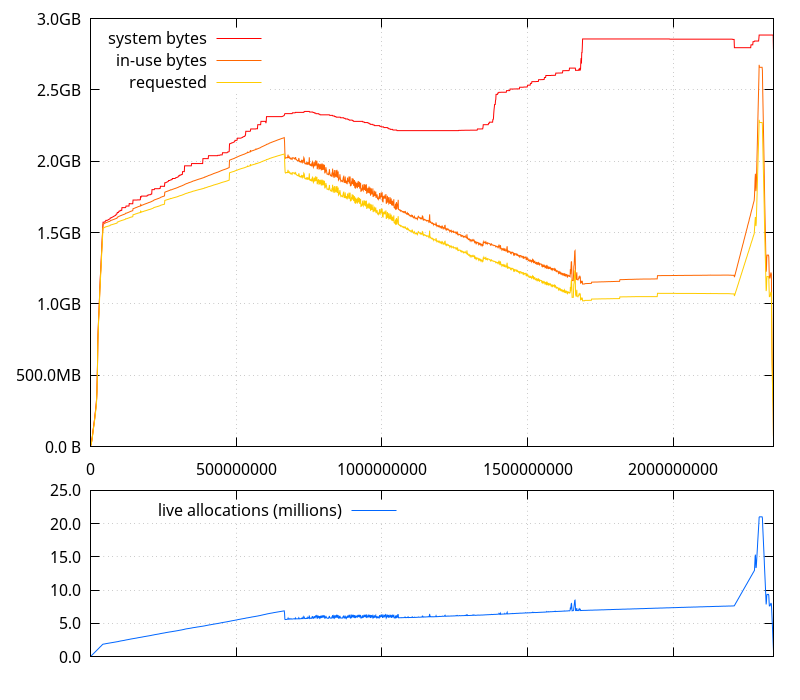
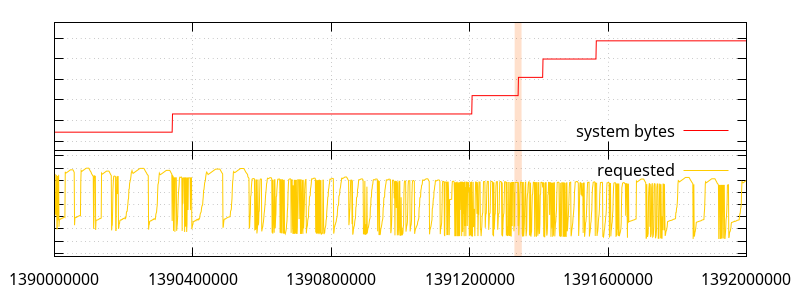
Going back to the first graph, let's get a closer look at what the allocations look like when the "system bytes" number is increasing a lot. The highlights in the following graphs indicate the range the next graph will be showing.


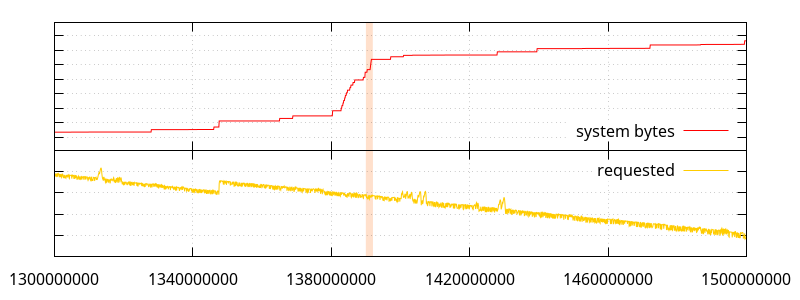
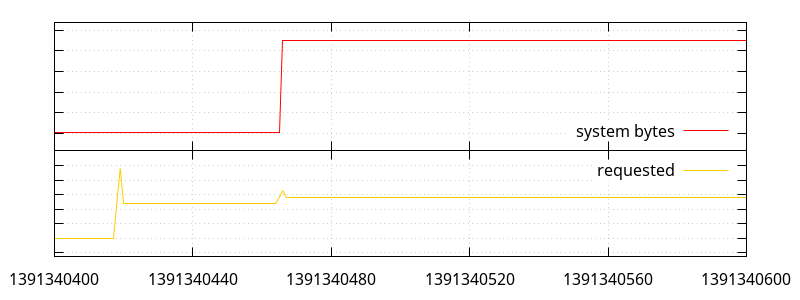
So what we have here is a bunch of small allocations (small enough that they don't seem to move the "requested" line ; most under 512 bytes, so under normal circumstances, they would be allocated by python, a few between 512 and 2048 bytes), and a few large allocations, one of which triggers a bump in memory use.

What can appear weird at first glance is that we have a large allocation not requiring more system memory, later followed by a smaller one that does. What the allocations actually look like is the following:


void *ptr0 = malloc(4850928); // #1391340418
void *ptr1 = realloc(some_old_ptr, 8000835); // #1391340419
free(ptr0); // #1391340420
ptr1 = realloc(ptr1, 8000925); // #1391340421
/* ... */
void *ptrn = malloc(879931); // #1391340465
ptr1 = realloc(ptr1, 8880819); // #1391340466
free(ptrn); // #1391340467

As it turns out, inspecting all the live allocations at that point, while there was a hole large enough to do the first two reallocs (the second actually happens in place), at the point of the third one, there wasn't a large enough hole to fit 8.8MB.

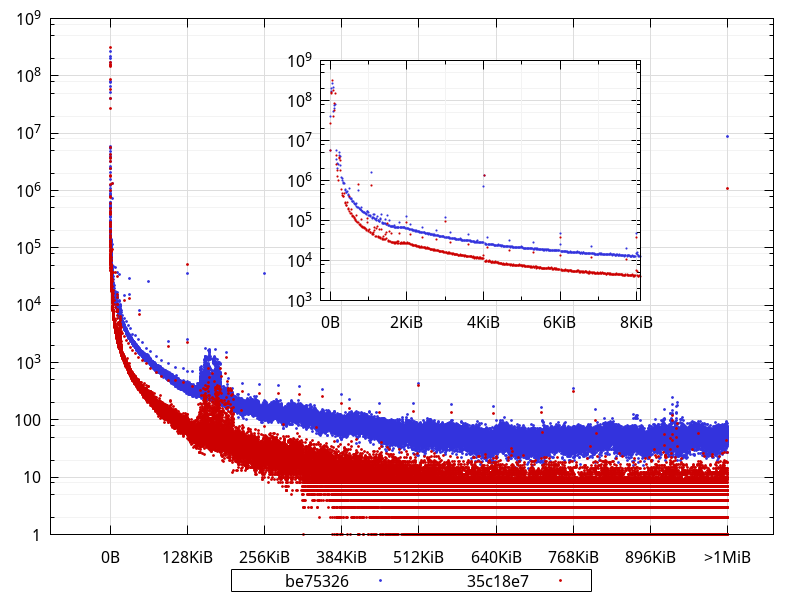
What inspecting the live allocations also reveals, is that there is a large number of large holes between all the allocated memory ranges, presumably coming from previous similar patterns. There are, in fact, 91 holes larger than 1MB, 24 of which are larger than 8MB. It's the accumulation of those holes that can't be used to fulfil larger allocations that makes the memory use explode. And there aren't enough small allocations happening to fill those holes. In fact, the global trend is for less and less memory to be allocated, so, smaller holes are also being poked all the time.

Really, it's all a straightforward case of memory fragmentation. The reason it tends not to happen with jemalloc is that jemalloc groups allocations by sizes, which the glibc allocator doesn't seem to be doing. The following is how we got a hole that couldn't fit the 8.8MB allocation in the first place:


ptr1 = realloc(ptr1, 8880467); // #1391324989; ptr1 is 0x5555de145600
/* ... */
void *ptrx = malloc(232); // #1391325001; ptrx is 0x5555de9bd760 ; that is 13 bytes after the end of ptr1.
/* ... */
free(ptr1); // #1391325728; this leaves a hole of 8880480 bytes at 0x5555de145600.

All would go well if ptrx was free()d, but it looks like it's long-lived. At least, it's still allocated by the time we reach the allocator call #1391340466. And since the hole is 339 bytes too short for the requested allocation, the allocator has no other choice than request more memory to the system.

What's bothering, though, is that the allocator chose to allocate ptrx in the space following ptr1, when it allocated similarly sized buffers after allocating ptr1 and before allocating ptrx in completely different places, and while there are plenty of holes in the allocated memory where it could fit.

Interestingly enough, ptrx is a 232 bytes allocation, which means under normal circumstances, python itself would be allocating it. In all likeliness, when the python allocator is enabled, it's allocations larger than 512 bytes that become obstacles to the larger allocations. Another possibility is that the 256KB fragments that the python allocator itself allocates to hold its own allocations become the obstacles (my original hypothesis). I think the former is more likely, though, putting back the blame entirely on glibc's shoulders.

Now, it looks like the allocation pattern we have here is suboptimal, so I re-ran a git clone under a debugger to catch when a realloc() for 8880819 bytes happens (the size is peculiar enough that it only happened once in the allocation log). But doing that with a conditional breakpoint is just too slow, so I injected a realloc wrapper with LD_PRELOAD that sends a SIGTRAP signal to the process, so that an attached debugger can catch it.

Thanks to the support for python in gdb, it was then posible to pinpoint the exact python instructions that made the realloc() call (it didn't come as a surprise ; in fact, that was one of the places I had in mind, but I wanted definite proof):


new = ''
end = 0
# ...
for diff in RevDiff(rev_patch):
    new += data[end:diff.start]
    new += diff.text_data
    end = diff.end
    # ...
new += data[end:]

What happens here is that we're creating a mercurial manifest we got from the server in patch form against a previous manifest. So data contains the original manifest, and rev_patch the patch. The patch essentially contains instructions of the form "replace n bytes at offset o with the content c".

The code here just does that in the most straightforward way, implementation-wise, but also, it turns out, possibly the worst way.

So let's unroll this loop over a couple iterations:

new = ''

This allocates an empty str object. In fact, this doesn't actually allocate anything, and only creates a pointer to an interned representation of an empty string.

new += data[0:diff.start]

This is where things start to get awful. data is a str, so data[0:diff.start] creates a new, separate, str for the substring. One allocation, one copy.

Then appends it to new. Fortunately, CPython is smart enough, and just assigns data[0:diff.start] to new. This can easily be verified with the CPython REPL:

>>> foo = ''
>>> bar = 'bar'
>>> foo += bar
>>> foo is bar
True

(and this is not happening because the example string is small here ; it also happens with larger strings, like 'bar' * 42000)

Back to our loop:

new += diff.text_data

Now, new is realloc()ated to have the right size to fit the appended text in it, and the contents of diff.text_data is copied. One realloc, one copy.

Let's go for a second iteration:

new += data[diff.end:new_diff.start]

Here again, we're doing an allocation for the substring, and one copy. Then new is realloc()ated again to append the substring, which is an additional copy.

new += new_diff.text_data

new is realloc()ated yet again to append the contents of new_diff.text_data.

We now finish with:

new += data[new_diff.end:]

which, again creates a substring from the data, and then proceeds to realloc()ate new one freaking more time.

That's a lot of malloc()s and realloc()s to be doing...

  • It is possible to limit the number of realloc()s by using new = bytearray() instead of new = ''. I haven't looked in the CPython code what the growth strategy is, but, for example, appending a 4KB string to a 500KB bytearray makes it grow to 600KB instead of 504KB, like what happens when using str.
  • It is possible to avoid realloc()s completely by preallocating the right size for the bytearray (with bytearray(size)), but that requires looping over the patch once first to know the new size, or using an estimate (the new manifest can't be larger than the size of the previous manifest + the size of the patch) and truncating later (although I'm not sure it's possible to truncate a bytearray without a realloc()). As a downside, this initializes the buffer with null bytes, which is a waste of time.
  • Another possibility is to reuse bytearrays previously allocated for previous manifests.
  • Yet another possibility is to accumulate the strings to append and use ''.join(). CPython is smart enough to create a single allocation for the total size in that case. That would be the most convenient solution, but see below.
  • It is possible to avoid the intermediate allocations and copies for substrings from the original manifest by using memoryview.
  • Unfortunately, you can't use ''.join() on a list of memoryviews before Python 3.4.

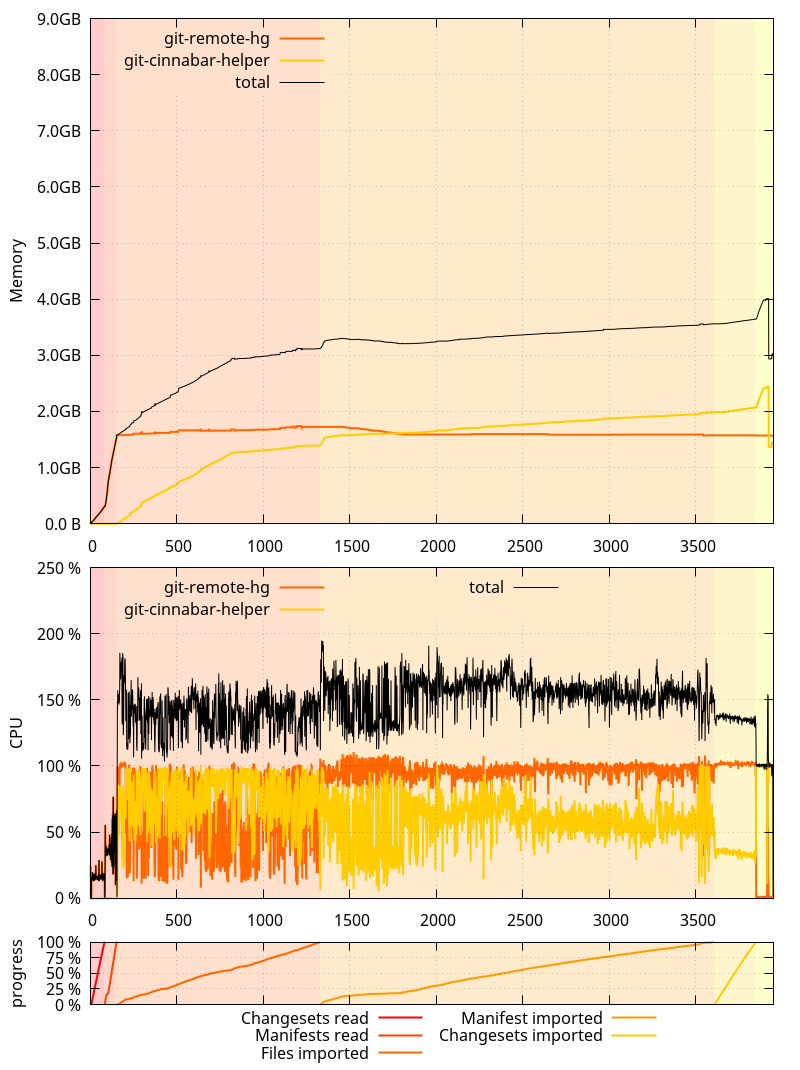
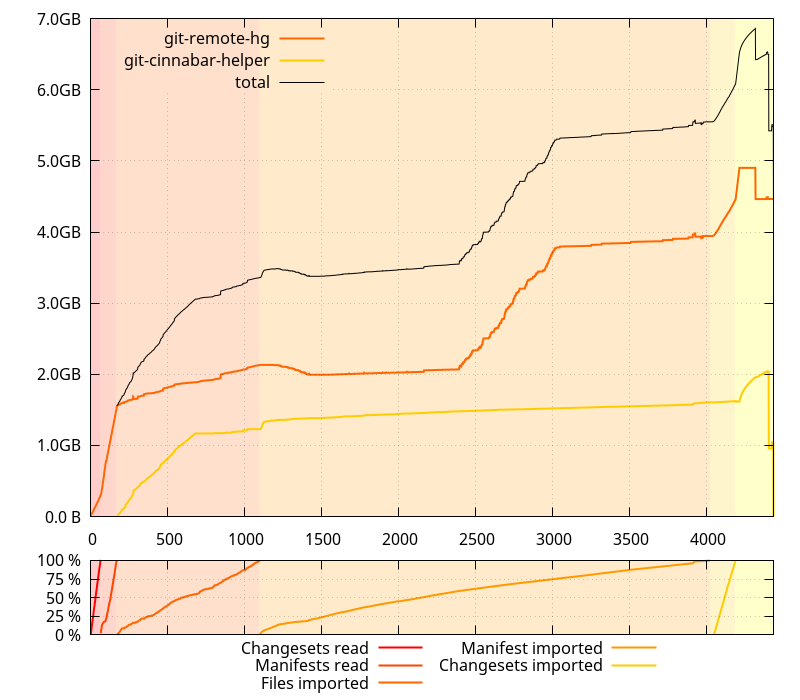
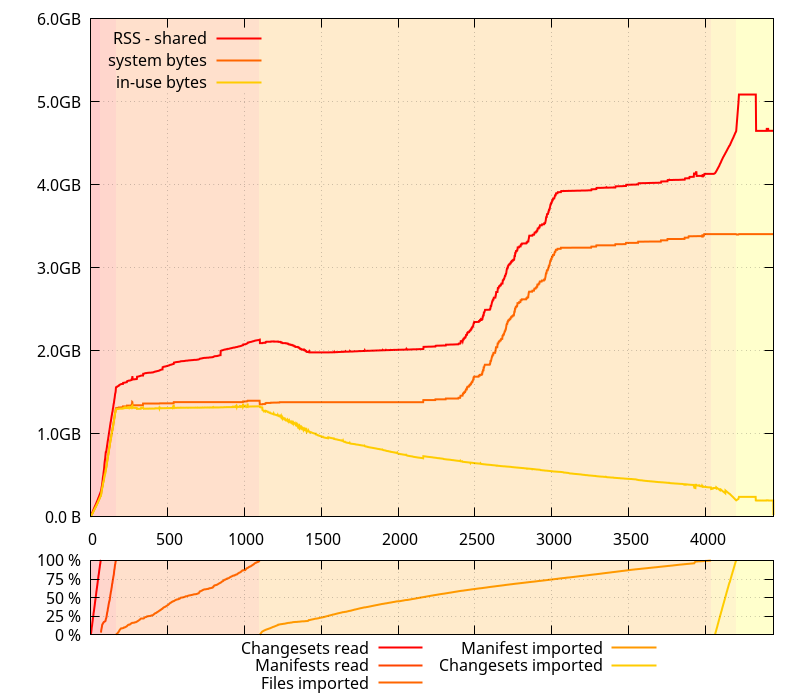
After modifying the code to implement the first and fifth items, memory usage during a git clone of mozilla-central looks like the following (with the python allocator enabled):

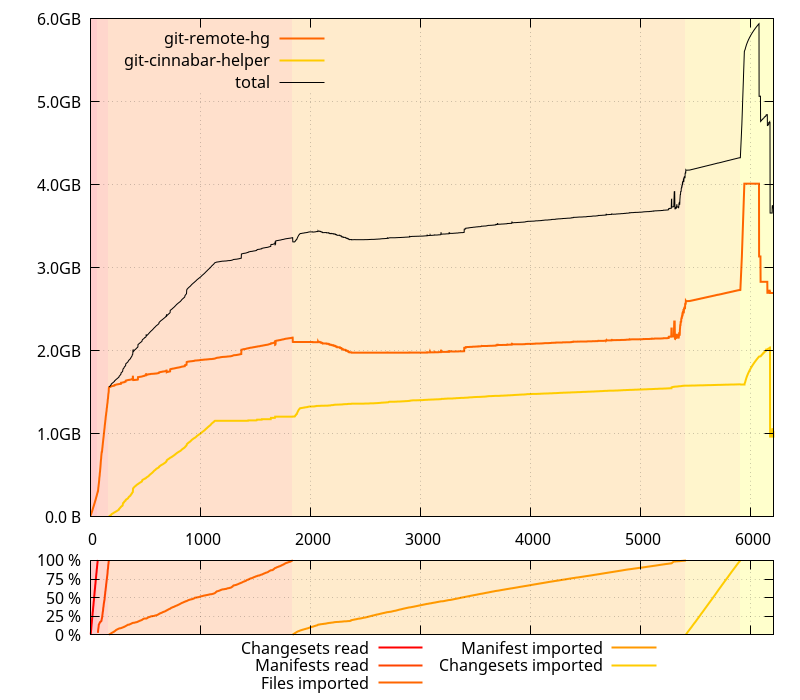
(Note this hasn't actually landed on the master branch yet)

Compared to what it looked like before, this is largely better. But that's not the only difference: the clone was also about 1000 seconds faster. That's more than 15 minutes! But that's not all so surprising when you know the volumes of data handled here. More insight about this coming in an upcoming post.

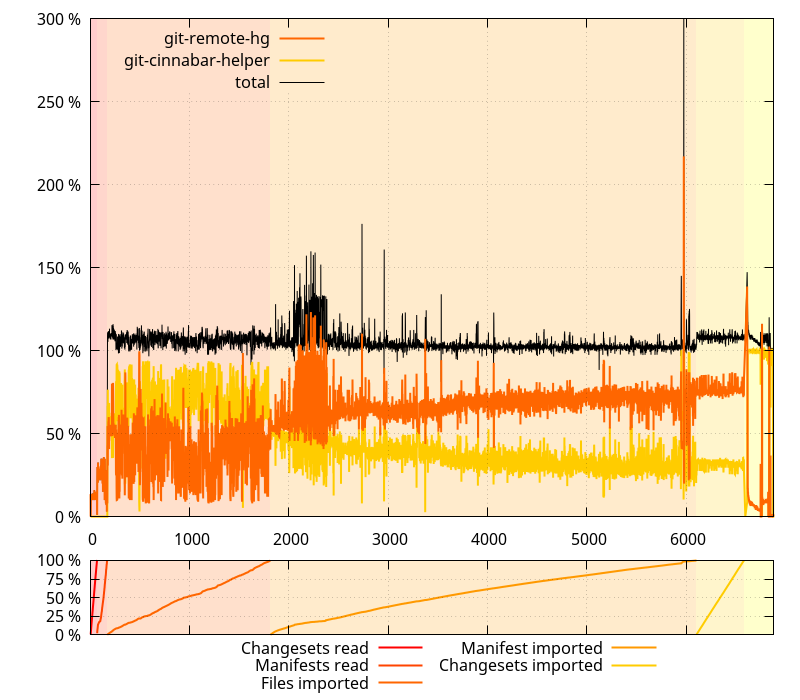
But while the changes outlined above make the glibc allocator behavior less likely to happen, it doesn't totally obliviate it. In fact, it seems it is still happening by the end of the manifest import phase. We're still allocating increasingly large temporary buffers because the size of the imported manifests grows larger and larger, and every one of them is the result of patching a previous one.

The only way to avoid those large allocations creating holes would be to avoid doing them in the first place. My first attempt at doing that, keeping manifests as lists of lines instead of raw buffers, worked, but was terribly slow. So slow, in fact, that I had to stop a clone early and estimated the process would likely have taken a couple days. Iterating over multiple generators at the same time, a lot, kills performance, apparently. I'll have to try with significantly less of that.

2017-03-22 15:57:46+0900

cinnabar, p.m.o | 4 Comments »

When the memory allocator works against you

Cloning mozilla-central with git-cinnabar requires a lot of memory. Actually too much memory to fit in a 32-bits address space.

I hadn't optimized for memory use in the first place. For instance, git-cinnabar keeps sha-1s in memory as hex values (40 bytes) rather than raw values (20 bytes). When I wrote the initial prototype, it didn't matter that much, and while close(ish) to the tipping point, it didn't require more than 2GB of memory at the time.

Time passed, and mozilla-central grew. I suspect the recent addition of several thousands of commits and files has made things worse.

In order to come up with a plan to make things better (short or longer term), I needed data. So I added some basic memory resource tracking, and collected data while cloning mozilla-central.

I must admit, I was not ready for what I witnessed. Follow me for a tale of frustrations (plural).

I was expecting things to have gotten worse on the master branch (which I used for the data collection) because I am in the middle of some refactoring and did many changes that I was suspecting might have affected memory usage. I wasn't, however, expecting to see the clone command using 10GB(!) memory at peak usage across all processes.

(Note, those memory sizes are RSS, minus "shared")

It also was taking an unexpected long time, but then, I hadn't cloned a large repository like mozilla-central from scratch in a while, so I wasn't sure if it was just related to its recent growth in size or otherwise. So I collected data on 0.4.0 as well.

Less time spent, less memory usage... ok. There's definitely something wrong on master. But wait a minute, that slope from ~2GB to ~4GB on the git-remote-hg process doesn't actually make any kind of sense. I mean, I'd understand it if it were starting and finishing with the "Import manifest" phase, but it starts in the middle of it, and ends long before it finishes. WTH?

First things first, since RSS can be a variety of things, I checked /proc/$pid/smaps and confirmed that most of it was, indeed, the heap.

That's the point where you reach for Google, type something like "python memory profile" and find various tools. One from the results that I remembered having used in the past is guppy's heapy.

Armed with pdb, I broke execution in the middle of the slope, and tried to get memory stats with heapy. SIGSEGV. Ouch.

Let's try something else. I reached out to objgraph and pympler. SIGSEGV. Ouch again.

Tried working around the crashes for a while (too long while, retrospectively, hindsight is 20/20), and was somehow successful at avoiding them by peaking at a smaller set of objects. But whatever I did, despite being attached to a process that had 2.6GB RSS, I wasn't able to find more than 1.3GB of data. This wasn't adding up.

It surely didn't help that getting to that point took close to an hour each time. Retrospectively, I wish I had investigated using something like Checkpoint/Restore in Userspace.

Anyways, after a while, I decided that I really wanted to try to see the whole picture, not smaller peaks here and there that might be missing something. So I resolved myself to look at the SIGSEGV I was getting when using pympler, collecting a core dump when it happened.

Guess what? The Debian python-dbg package does not contain the debug symbols for the python package. The core dump was useless.

Since I was expecting I'd have to fix something in python, I just downloaded its source and built it. Ran the command again, waited, and finally got a backtrace. First Google hit for the crashing function? The exact (unfixed) crash reported on the python bug tracker. No patch.

Crashing code is doing:

((f)->f_builtins != (f)->f_tstate->interp->builtins)

And (f)->f_tstate is NULL. Classic NULL deref.

Added a guard (assessing it wouldn't break anything). Ran the command again. Waited. Again. SIGSEGV.

Facedesk. Another crash on the same line. Did I really use the patched python? Yes. But this time (f)->f_tstate->interp is NULL. Sigh.

Same player, shoot again.

Finally, no crash... but still stuck on only 1.3GB accounted for. Ok, I know not all python memory profiling tools are entirely reliable, let's try heapy again. SIGSEGV. Sigh. No debug info on the heapy module, where the crash happens. Sigh. Rebuild the module with debug info, try again. The backtrace looks like heapy is recursing a lot. Look at %rsp, compare with the address space from /proc/$pid/maps. Confirmed. A stack overflow. Let's do ugly things and increase the stack size in brutal ways.

Woohoo! Now heapy tells me there's even less memory used than the 1.3GB I found so far. Like, half less. Yeah, right.

I'm not clear on how I got there, but that's when I found gdb-heap, a tool from Red Hat's David Malcolm, and the associated talk "Dude, where's my RAM?" A deep dive into how Python uses memory (slides).

With a gdb attached, I would finally be able to rip python's guts out and find where all the memory went. Or so I thought. The gdb-heap tool only found about 600MB. About as much as heapy did, for that matter, but it could be coincidental. Oh. Kay.

I don't remember exactly what went through my mind then, but, since I was attached to a running process with gdb, I typed the following on the gdb prompt:

gdb> call malloc_stats()

And that's when the truth was finally unvealed: the memory allocator was just acting up the whole time. The ouput was something like:

Arena 0:
system bytes    =  some number above (but close to) 2GB
in use bytes    =  some number above (but close to) 600MB

Yes, the glibc allocator was just telling it had allocated 600MB of memory, but was holding onto 2GB. I must have found a really bad allocation pattern that causes massive fragmentation.

One thing that David Malcolm's talk taught me, though, is that python uses its own allocator for small sizes, so the glibc allocator doesn't know about them. And, roughly, adding the difference between RSS and what glibc said it was holding to to the use bytes it reported somehow matches the 1.3GB I had found so far.

So it was time to see how those things evolved in time, during the entire clone process. I grabbed some new data, tracking the evolution of "system bytes" and "in use bytes".

There are two things of note on this data:

  • There is a relatively large gap between what the glibc allocator says it has gotten from the system, and the RSS (minus "shared") size, that I'm expecting corresponds to the small allocations that python handles itself.
  • Actual memory use is going down during the "Import manifests" phase, contrary to what the evolution of RSS suggests.

In fact, the latter is exactly how git-cinnabar is supposed to work: It reads changesets and manifests chunks, and holds onto them while importing files. Then it throws away those manifests and changesets chunks one by one while it imports them. There is, however, some extra bookkeeping that requires some additional memory, but it's expected to be less memory consuming than keeping all the changesets and manifests chunks in memory.

At this point, I thought a possible explanation is that since both python and glibc are mmap()ing their own arenas, they might be intertwined in a way that makes things not go well with the allocation pattern happening during the "Import manifest" phase (which, in fact, allocates and frees increasingly large buffers for each manifest, as manifests grow in size in the mozilla-central history).

To put the theory at work, I patched the python interpreter again, making it use malloc() instead of mmap() for its arenas.

"Aha!" I thought. That definitely looks much better. Less gap between what glibc says it requested from the system and the RSS size. And, more importantly, no runaway increase of memory usage in the middle of nowhere.

I was preparing myself to write a post about how mixing allocators could have unintended consequences. As a comparison point, I went ahead and ran another test, with the python allocator entirely disabled, this time.

Heh. It turns out glibc was acting up all alone. So much for my (plausible) theory. (I still think mixing allocators can have unintended consequences.)

(Note, however, that the reason why the python allocator exists is valid: without it, the overall clone took almost 10 more minutes)

And since I had been getting all this data with 0.4.0, I gathered new data without the python allocator with the master branch.

This paints a rather different picture than the original data on that branch, with much less memory use regression than one would think. In fact, there isn't much difference, except for the spike at the end, which got worse, and some of the noise during the "Import manifests" phase that got bigger, implying larger amounts of temporary memory used. The latter may contribute to the allocation patterns that throw glibc's memory allocator off.

It turns out tracking memory usage in python 2.7 is rather painful, and not all the tools paint a complete picture of it. I hear python 3.x is somewhat better in that regard, and I hope it's true, but at the moment, I'm stuck with 2.7. The most reliable tool I've used here, it turns out, is pympler. Or rebuilding the python interpreter without its allocator, and asking the system allocator what is allocated.

With all this data, I now have some defined problems to tackle, some easy (the spike at the end of the clone), and some less easy (working around glibc allocator's behavior). I have a few hunches as to what kind of allocations are causing the runaway increase of RSS. Coincidentally, I'm half-way through a refactor of the code dealing with manifests, and it should help dealing with the issue.

But that will be the subject of a subsequent post.

2017-03-12 10:47:12+0900

cinnabar, p.m.o | 5 Comments »

Announcing git-cinnabar 0.4.0

Git-cinnabar is a git remote helper to interact with mercurial repositories. It allows to clone, pull and push from/to mercurial remote repositories, using git.

Get it on github.

These release notes are also available on the git-cinnabar wiki.

What's new since 0.3.2?

  • Various bug fixes.
  • Updated git to 2.11.0 for cinnabar-helper.
  • Now supports bundle2 for both fetch/clone and push (https://www.mercurial-scm.org/wiki/BundleFormat2).
  • Now Supports git credential for HTTP authentication.
  • Now supports git push --dry-run.
  • Added a new git cinnabar fetch command to fetch a specific revision that is not necessarily a head.
  • Added a new git cinnabar download command to download a helper on platforms where one is available.
  • Removed upgrade path from repositories used with version < 0.3.0.
  • Experimental (and partial) support for using git-cinnabar without having mercurial installed.
  • Use a mercurial subprocess to access local mercurial repositories.
  • Cinnabar-helper now handles fast-import, with workarounds for performance issues on macOS.
  • Fixed some corner cases involving empty files. This prevented cloning Mozilla's stylo incubator repository.
  • Fixed some correctness issues in file parenting when pushing changesets pulled from one mercurial repository to another.
  • Various improvements to the rules to build the helper.
  • Experimental (and slow) support for pushing merges, with caveats. See issue #20 for details about the current status.
  • Fail graft earlier when no commit was found to graft
  • Allow graft to work with git version < 1.9
  • Allow git cinnabar bundle to do the same grafting as git push

2017-01-18 18:21:45+0900

cinnabar, p.m.o | No Comments »

Announcing git-cinnabar 0.4.0 release candidate 2

Git-cinnabar is a git remote helper to interact with mercurial repositories. It allows to clone, pull and push from/to mercurial remote repositories, using git.

Get it on github.

These release notes are also available on the git-cinnabar wiki.

What's new since 0.4.0rc?

  • /!\ Warning /!\ If you have been using a version of the release branch between 0.4.0rc and 0.4.0rc2 (more precisely, in the range 0335aa1432bdb0a8b5bdbefa98f7c2cd95fc72d2^..0.4.0rc2^), and used git cinnabar download and run on Mac or Windows, please run git cinnabar download again with this version and then ensure your mercurial clones have not been corrupted by case-sensitivity issues by running git cinnabar fsck --manifests. If they contain sha1 mismatches, please reclone.
  • Updated git to 2.11.0 for cinnabar-helper
  • Improvements to the git cinnabar download command
  • Various small code cleanups
  • Improvement to the experimental support for pushing merges

2016-12-20 18:06:49+0900

cinnabar, p.m.o | No Comments »

Faster git-cinnabar graft of gecko-dev

Cloning Mozilla repositories from scratch with git-cinnabar can be a long process. Grafting them to gecko-dev is an equally long process.

The metadata git-cinnabar keeps is such that it can be exchanged, but it's also structured in a way that doesn't allow git push and fetch to do that efficiently, and pushing refs/cinnabar/metadata to github fails because it wants to push more than 2GB of data, which github doesn't allow.

But with some munging before a push, it is possible to limit the push to a fraction of that size and stay within github limits. And inversely, some munging after fetching allows to produce the metadata git-cinnabar wants.

The news here is that there is now a cinnabar head on https://github.com/glandium/gecko-dev that contains the munged metadata, and a script that fetches it and produces the git-cinnabar metadata in an existing clone of gecko-dev. An easy way to run it is to use the following command from a gecko-dev clone:

$ curl -sL https://gist.github.com/glandium/56a61454b2c3a1ad2cc269cc91292a56/raw/bfb66d417cd1ab07d96ebe64cdb83a4217703db9/import.py | git cinnabar python

On my machine, the process takes 8 minutes instead of more than an hour. Make sure you use git-cinnabar 0.4.0rc for this.

Please note this doesn't bring the full metadata for gecko-dev, just the metadata as of yesterday. This may be updated irregularly in the future, but don't count on that.

So, from there, you still need to add mercurial remotes and pull from there, as per the original workflow.

Planned changes for version 0.5 of git-cinnabar will alter the metadata format such that it will be exchangeable without munging, making the process simpler and faster.

2016-12-02 14:31:28+0900

p.m.o | No Comments »