Progress on git-cinnabar memory usage
This all started when I figured out that git-cinnabar was using crazy amounts of memory when cloning mozilla-central. That pointed to memory allocation patterns that triggered a suboptimal behavior in the glibc memory allocator, and, while overall, git-cinnabar wasn't really abusing memory all things considered, it happened to be realloc()ating way too much.
It also turned out that recent changes on the master branch had made most uses of fast-import synchronous, making the whole process significantly slower.
This is where we started from on 0.4.0:
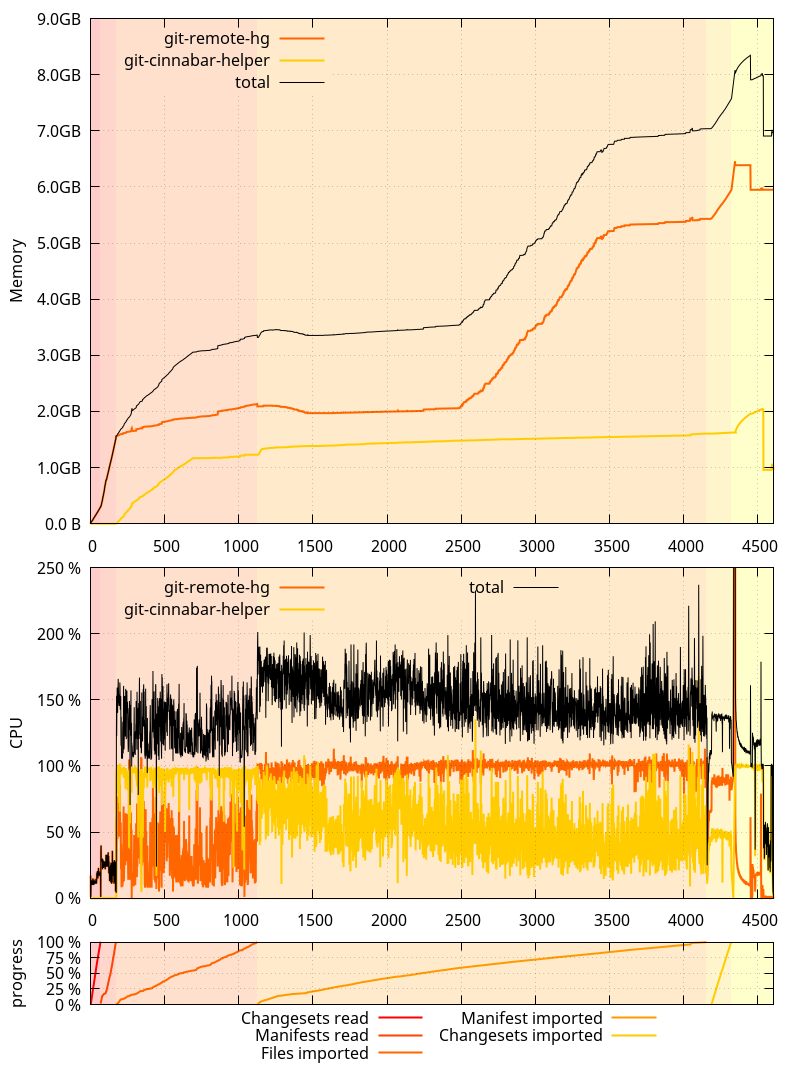
And on the master branch as of be75326:
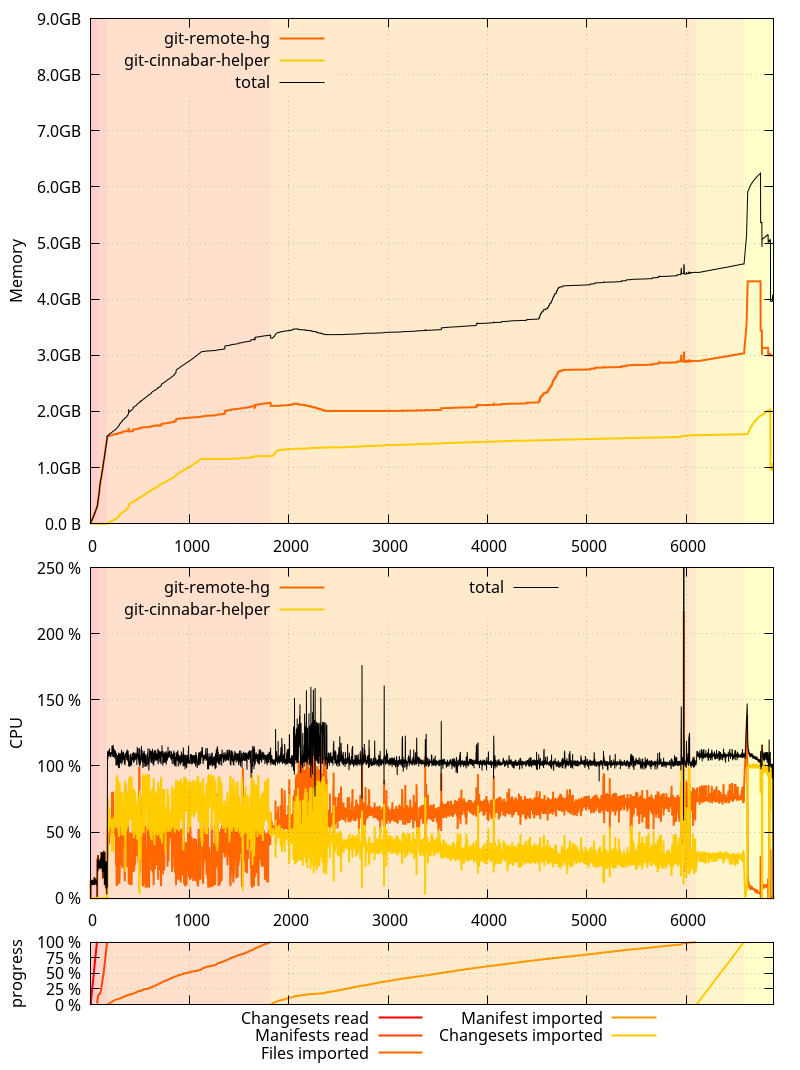
An interesting thing to note here is that the glibc allocator runaway memory use was, this time, more pronounced on 0.4.0 than on master. It was the opposite originally, but as I mentioned in the past ASLR is making it not happen exactly the same way each time.
While I'm here, one thing I failed to mention in the previous posts is that all these measurements were done by cloning a local mercurial clone of mozilla-central, served from localhost via HTTP to eliminate the download time from hg.mozilla.org. And while mozilla-central itself has received new changesets since the first post, the local clone has not been updated, such that all subsequent clone tests I did were cloning the exact same repository under the exact same circumstances.
After last blog post, I focused on the low hanging fruits identified so far:
- Moving the mercurial to git SHA1 mapping to the helper process (Finding a git bug in the process).
- Tracking mercurial manifest heads in the helper process.
- Removing most of the synchronous calls to the helper happening during a clone.
And this is how things now look on the master branch as of 35c18e7:
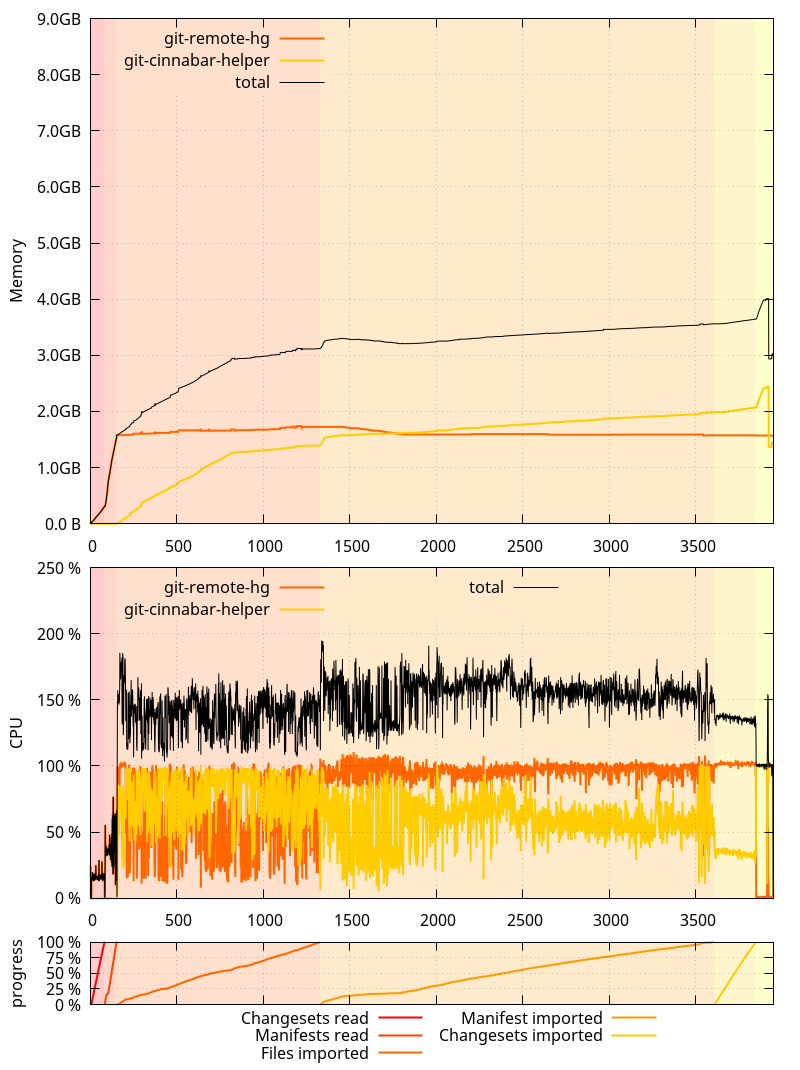
So where does that put us?
- The overall clone is now about 11 minutes faster than 0.4.0 (and about 50 minutes faster than master as of be75326!)
- Non-shared memory use of the
git-remote-hgprocess stays well under 2GB during the whole clone, with no spike at the end. git-cinnabar-helpernow uses more memory, but the sum of both processes is less than what it used to be, even when compensating for the glibc memory allocator issue. One thing to note is that while thegit-cinnabar-helpermemory use goes above 2GB at the end of the clone, a very large part is due to the pack window size being 1GB on 64-bits (vs. 32MB on 32-bits). Memory usage should stay well under the 2GB address space limit on a 32-bits system.- CPU usage is well above 100% for most of the clone.
On a more granular level:
- The "Import manifests" phase is now 13 minutes faster than it was in 0.4.0.
- The "Read and import files" phase is still almost 4 minutes slower than in 0.4.0.
- The "Import changesets" phase is still almost 2 minutes slower than in 0.4.0.
- But the "Finalization" phase is now 3 minutes faster than in 0.4.0.
What this means is that there's still room for improvement. But at this point, I'd rather focus on other things.
Logging all the memory allocations with the python allocator disabled still resulted in a 6.5GB compressed log file, containing 2.6 billion calls to malloc, calloc, free and realloc (down from 2.7 billions in be75326). The number of allocator calls done by the git-remote-hg process is down to 2.25 billions (from 2.34 billion in be75326).
Surprisingly, while more things were moved to the helper, it still made less allocations than in be75326: 345 millions, down from 363 millions. Presumably, this is because the number of commands processed by the fast-import code was reduced.
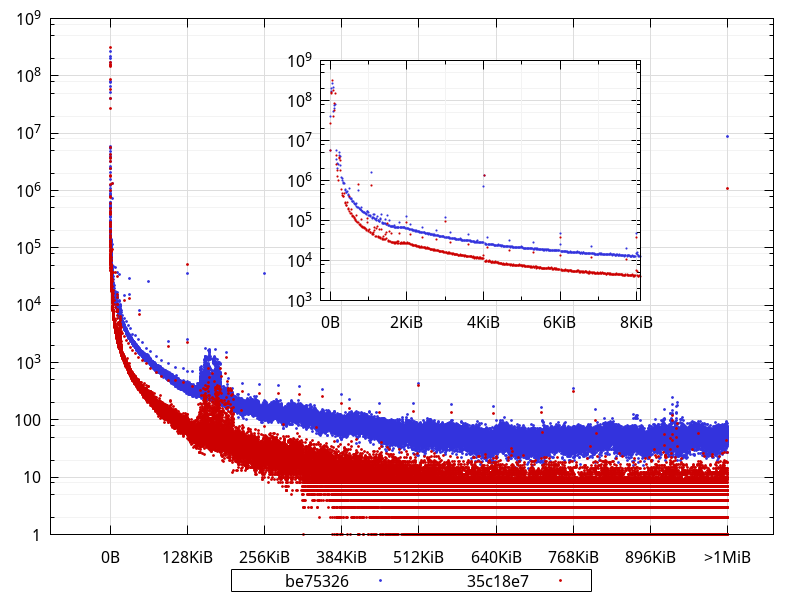
Let's now take a look at the various metrics we analyzed previously (the horizontal axis represents the number of allocator calls that happened before the measurement):
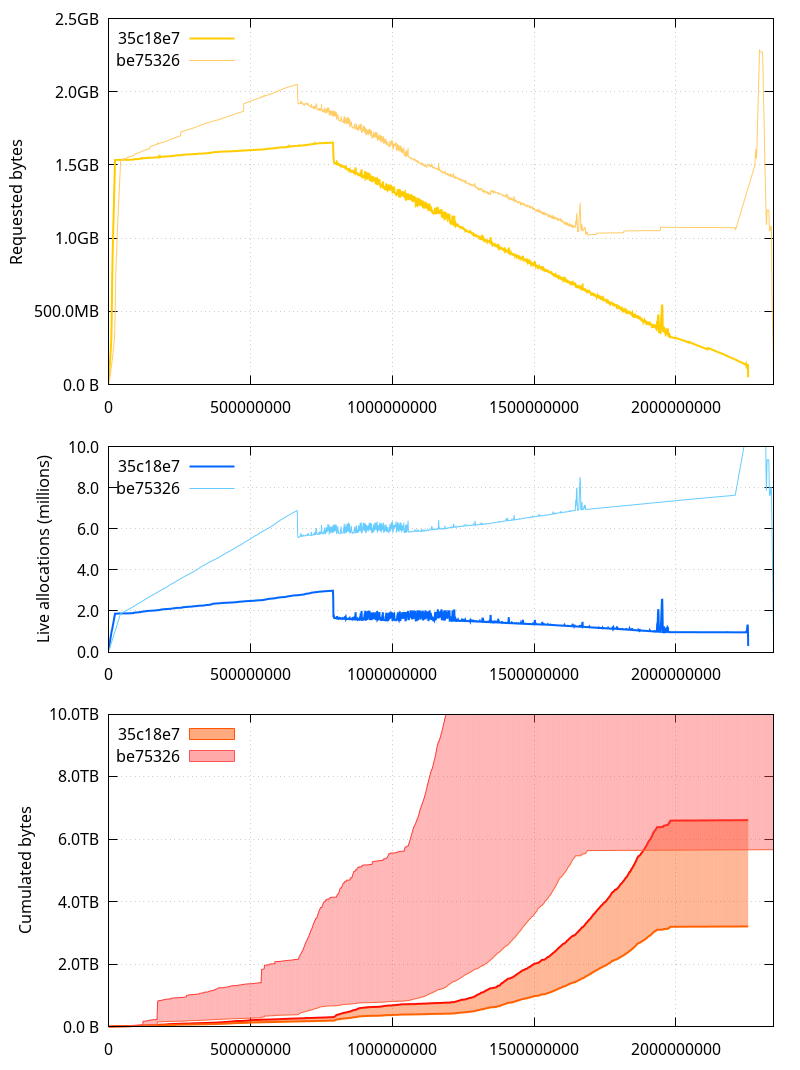
A few observations to make here:
- The allocated memory (requested bytes) is well below what it was, and the spike at the end is entirely gone. It also more closely follows the amount of raw data we're holding on to (which makes sense since most of the bookkeeping was moved to the helper)
- The number of live allocations (allocated memory pointers that haven't been
free()d yet) has gone significantly down as well. - The cumulated[*] bytes are now in a much more reasonable range, with the lower bound close to the total amount of data we're dealing with during the clone, and the upper bound slightly over twice that amount (the upper bound for the be75326 is not shown here, but it was around 45TB; less than 7TB is a big improvement).
- There are less allocator calls during the first phases and the "Importing changesets" phase, but more during the "Reading and importing files" and "Importing manifests" phases.
[*] The upper bound is the sum of all sizes ever given to malloc, calloc, realloc etc. and the lower bound is the same, but removing the size of allocations passed as input to realloc (in practical words, this pretends reallocs never happened and that the final size for a given reallocated pointer is the one that counts)
So presumably, some of the changes led to more short-lived allocations. Considering python uses its own allocator for sizes smaller than 512 bytes, it's probably not so much of a problem. But let's look at the distribution of buffer sizes (including all sizes given to realloc).
(Bucket size is 16 bytes)
What is not completely obvious from the logarithmic scale is that, in fact, 98.4% of the allocations are less than 512 bytes with the current master (35c18e7), and they were 95.5% with be75326. Interestingly, though, in absolute numbers, there are less allocations smaller than 512 bytes in current master than in be75326 (1,194,268,071 vs 1,214,784,494). This suggests the extra allocations that happen during some phases are larger than that.
There are clearly less allocations across the board (apart from very few exceptions), and close to an order of magnitude less allocations larger than 1MiB. In fact, widening the bucket size to 32KiB shows an order of magnitude difference (or close) for most buckets:
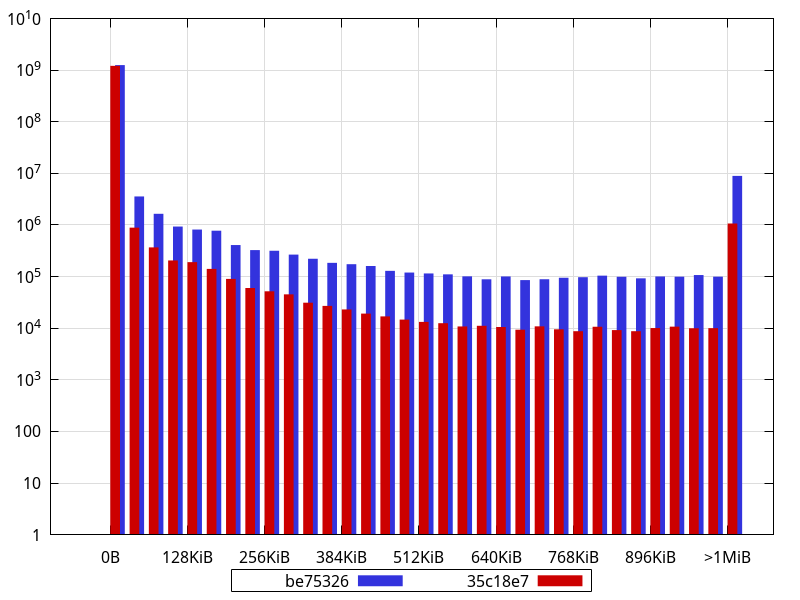
An interesting thing to note is how some sizes are largely overrepresented in the data with buckets of 16 bytes, like 768, 1104, 2048, 4128, with other smaller bumps for e.g. 2144, 2464, 2832, 3232, 3696, 4208, 4786, 5424, 6144, 6992, 7920... While some of those are powers of 2, most aren't, and some of them may actually represent objects sized with a power of 2, but that have an extra PyObject overhead.
While looking at allocation stats, I got to wonder what the lifetimes of those allocations looked like. So I scanned the allocator logs and measured the distance between when an allocation is made and when it is freed, ignoring reallocs.
To give a few examples of what I mean, the following allocation for p gets a lifetime of 0:
void *p = malloc(42);
free(p);
The following a lifetime of 1:
void *p = malloc(42);
void *other = malloc(42);
free(p);
And the following a lifetime of 1 as well:
void *p = malloc(42);
p = realloc(p, 84);
free(p);
(that is, it is not counted as two malloc/free pairs)
The further away the free is from the corresponding malloc, the larger the lifetime. And the largest the lifetime can ever be is the total number of allocator function calls minus two, in the hypothetical case the very first allocation is freed as the very last (minus two because we defined the lifetime as the distance).
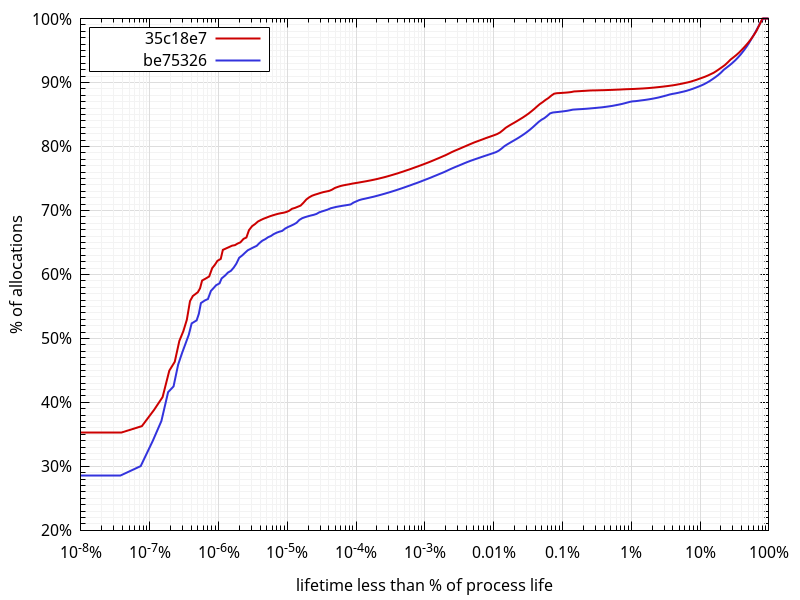
What comes out of this data:
- As expected, there are more short-lived allocations in 35c18e7.
- Around 90% of allocations have a lifetime spanning 10% of the process life or less. This is a rather surprisingly large amount of allocations with a very large lifetime.
- Around 80% of allocations have a lifetime spanning 0.01% of the process life or less.
- The median lifetime is around 0.0000002% (2*10-7%) of the process life, which, in absolute terms is around 500 allocator function calls between a
mallocand afree. - If we consider every imported changeset, manifest and file to require a similar number of allocations, and considering there are about 2.7M of them in total, each spans about 3.7*10-7%. About 53% of all allocations on be75326 and 57% on 35c18e7 have a lifetime below that. Whenever I get to look more closely to memory usage again, I'll probably look at the data separately for each individual phase.
- One surprising fact, that doesn't appear on the graph because of the logarithmic scale not showing "0" on the horizontal axis, is that 9.3% on be75326 and 7.3% on 35c18e7 of all allocations have a lifetime of 0. That is, whatever the code using them is doing, it's not allocating or freeing anything else, and not
reallocating them either.
All in all, what the data shows is that we're definitely in a better place now than we used to be a few days ago, and that there is still work to do on the memory front, but:
- As mentioned in a previous post, there are bigger wins to be had from not keeping manifests data around in memory at all, and by importing it directly instead.
- In time, a lot of the import code is meant to move to the helper, where the constraints are completely different, and it might not be worth spending time now on reducing the memory usage of python code that might go away soon(ish). The situation was bad and necessitated action rather quickly, but we're now in a place where it's not as bad anymore.
So at this point, I won't look any deeper into the memory usage of the git-remote-hg python process, and will instead focus on the planned metadata storage changes. They will allow to share the metadata more easily (allowing faster and more straightforward gecko-dev graft), and will allow to import manifests earlier, which, as mentioned already, will help reduce memory use, but, more importantly, will allow to do more actual work while downloading the data. On slow networks, this is crucial to make clones and pulls faster.
2017-04-01 18:45:19+0900
Responses are currently closed, but you can trackback from your own site.
