When the memory allocator works against you
Cloning mozilla-central with git-cinnabar requires a lot of memory. Actually too much memory to fit in a 32-bits address space.
I hadn't optimized for memory use in the first place. For instance, git-cinnabar keeps sha-1s in memory as hex values (40 bytes) rather than raw values (20 bytes). When I wrote the initial prototype, it didn't matter that much, and while close(ish) to the tipping point, it didn't require more than 2GB of memory at the time.
Time passed, and mozilla-central grew. I suspect the recent addition of several thousands of commits and files has made things worse.
In order to come up with a plan to make things better (short or longer term), I needed data. So I added some basic memory resource tracking, and collected data while cloning mozilla-central.
I must admit, I was not ready for what I witnessed. Follow me for a tale of frustrations (plural).
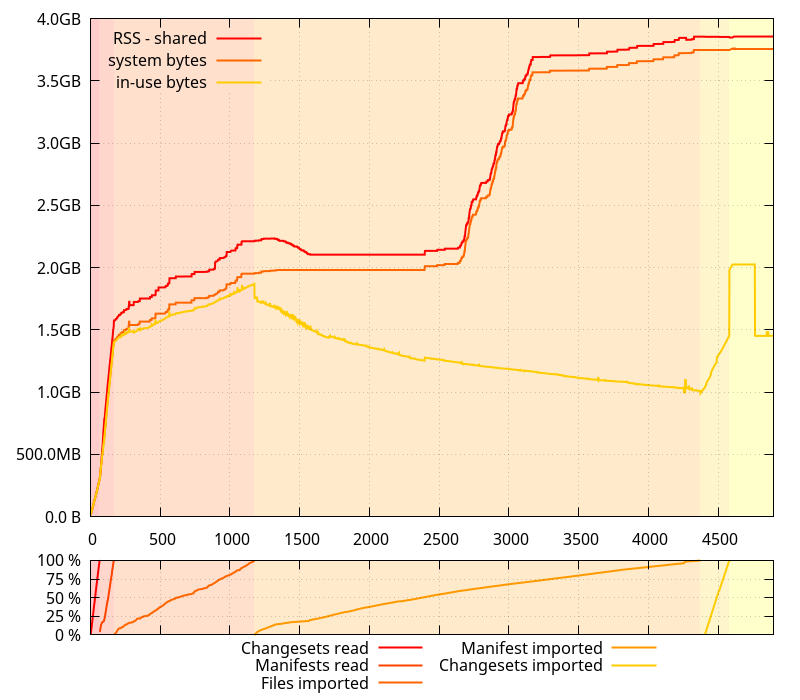
I was expecting things to have gotten worse on the master branch (which I used for the data collection) because I am in the middle of some refactoring and did many changes that I was suspecting might have affected memory usage. I wasn't, however, expecting to see the clone command using 10GB(!) memory at peak usage across all processes.
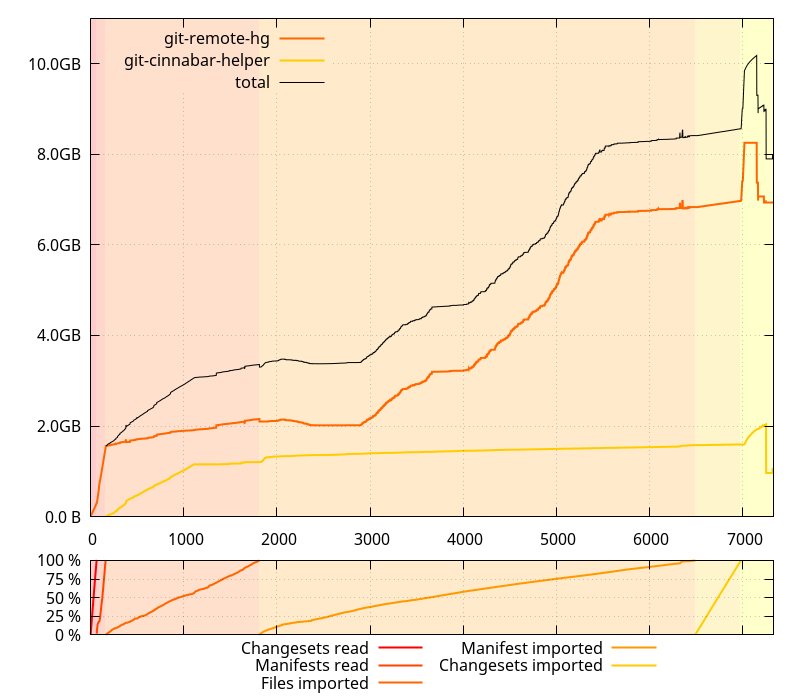
(Note, those memory sizes are RSS, minus "shared")
It also was taking an unexpected long time, but then, I hadn't cloned a large repository like mozilla-central from scratch in a while, so I wasn't sure if it was just related to its recent growth in size or otherwise. So I collected data on 0.4.0 as well.
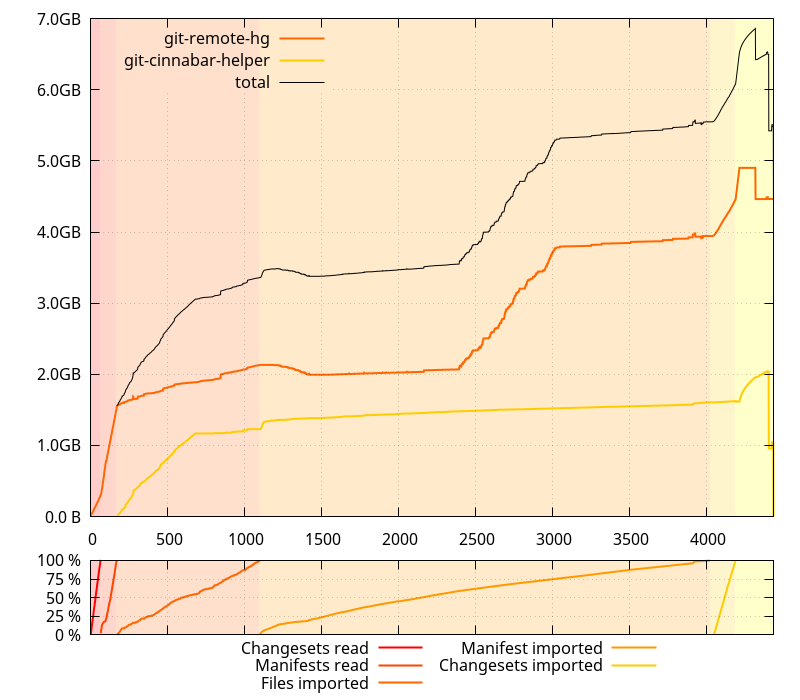
Less time spent, less memory usage... ok. There's definitely something wrong on master. But wait a minute, that slope from ~2GB to ~4GB on the git-remote-hg process doesn't actually make any kind of sense. I mean, I'd understand it if it were starting and finishing with the "Import manifest" phase, but it starts in the middle of it, and ends long before it finishes. WTH?
First things first, since RSS can be a variety of things, I checked /proc/$pid/smaps and confirmed that most of it was, indeed, the heap.
That's the point where you reach for Google, type something like "python memory profile" and find various tools. One from the results that I remembered having used in the past is guppy's heapy.
Armed with pdb, I broke execution in the middle of the slope, and tried to get memory stats with heapy. SIGSEGV. Ouch.
Let's try something else. I reached out to objgraph and pympler. SIGSEGV. Ouch again.
Tried working around the crashes for a while (too long while, retrospectively, hindsight is 20/20), and was somehow successful at avoiding them by peaking at a smaller set of objects. But whatever I did, despite being attached to a process that had 2.6GB RSS, I wasn't able to find more than 1.3GB of data. This wasn't adding up.
It surely didn't help that getting to that point took close to an hour each time. Retrospectively, I wish I had investigated using something like Checkpoint/Restore in Userspace.
Anyways, after a while, I decided that I really wanted to try to see the whole picture, not smaller peaks here and there that might be missing something. So I resolved myself to look at the SIGSEGV I was getting when using pympler, collecting a core dump when it happened.
Guess what? The Debian python-dbg package does not contain the debug symbols for the python package. The core dump was useless.
Since I was expecting I'd have to fix something in python, I just downloaded its source and built it. Ran the command again, waited, and finally got a backtrace. First Google hit for the crashing function? The exact (unfixed) crash reported on the python bug tracker. No patch.
Crashing code is doing:
((f)->f_builtins != (f)->f_tstate->interp->builtins)
And (f)->f_tstate is NULL. Classic NULL deref.
Added a guard (assessing it wouldn't break anything). Ran the command again. Waited. Again. SIGSEGV.
Facedesk. Another crash on the same line. Did I really use the patched python? Yes. But this time (f)->f_tstate->interp is NULL. Sigh.
Same player, shoot again.
Finally, no crash... but still stuck on only 1.3GB accounted for. Ok, I know not all python memory profiling tools are entirely reliable, let's try heapy again. SIGSEGV. Sigh. No debug info on the heapy module, where the crash happens. Sigh. Rebuild the module with debug info, try again. The backtrace looks like heapy is recursing a lot. Look at %rsp, compare with the address space from /proc/$pid/maps. Confirmed. A stack overflow. Let's do ugly things and increase the stack size in brutal ways.
Woohoo! Now heapy tells me there's even less memory used than the 1.3GB I found so far. Like, half less. Yeah, right.
I'm not clear on how I got there, but that's when I found gdb-heap, a tool from Red Hat's David Malcolm, and the associated talk "Dude, where's my RAM?" A deep dive into how Python uses memory (slides).
With a gdb attached, I would finally be able to rip python's guts out and find where all the memory went. Or so I thought. The gdb-heap tool only found about 600MB. About as much as heapy did, for that matter, but it could be coincidental. Oh. Kay.
I don't remember exactly what went through my mind then, but, since I was attached to a running process with gdb, I typed the following on the gdb prompt:
gdb> call malloc_stats()
And that's when the truth was finally unvealed: the memory allocator was just acting up the whole time. The ouput was something like:
Arena 0:
system bytes    =  some number above (but close to) 2GB
in use bytes    =  some number above (but close to) 600MB
Yes, the glibc allocator was just telling it had allocated 600MB of memory, but was holding onto 2GB. I must have found a really bad allocation pattern that causes massive fragmentation.
One thing that David Malcolm's talk taught me, though, is that python uses its own allocator for small sizes, so the glibc allocator doesn't know about them. And, roughly, adding the difference between RSS and what glibc said it was holding to to the use bytes it reported somehow matches the 1.3GB I had found so far.
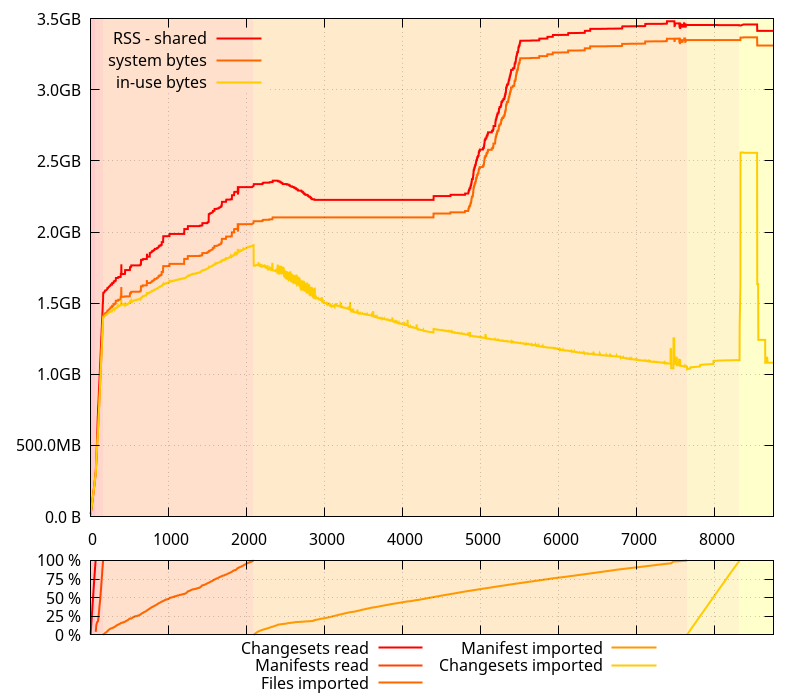
So it was time to see how those things evolved in time, during the entire clone process. I grabbed some new data, tracking the evolution of "system bytes" and "in use bytes".
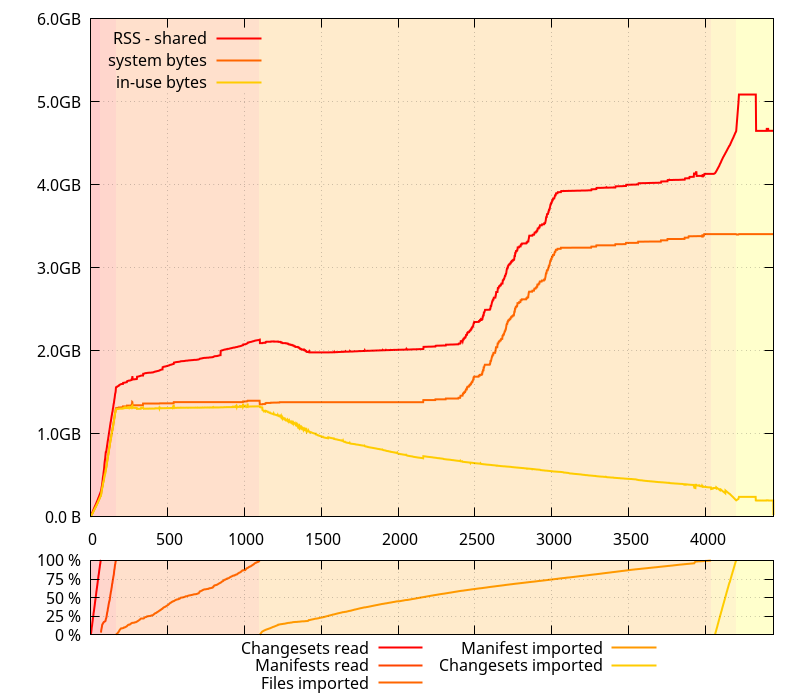
There are two things of note on this data:
- There is a relatively large gap between what the glibc allocator says it has gotten from the system, and the RSS (minus "shared") size, that I'm expecting corresponds to the small allocations that python handles itself.
- Actual memory use is going down during the "Import manifests" phase, contrary to what the evolution of RSS suggests.
In fact, the latter is exactly how git-cinnabar is supposed to work: It reads changesets and manifests chunks, and holds onto them while importing files. Then it throws away those manifests and changesets chunks one by one while it imports them. There is, however, some extra bookkeeping that requires some additional memory, but it's expected to be less memory consuming than keeping all the changesets and manifests chunks in memory.
At this point, I thought a possible explanation is that since both python and glibc are mmap()ing their own arenas, they might be intertwined in a way that makes things not go well with the allocation pattern happening during the "Import manifest" phase (which, in fact, allocates and frees increasingly large buffers for each manifest, as manifests grow in size in the mozilla-central history).
To put the theory at work, I patched the python interpreter again, making it use malloc() instead of mmap() for its arenas.
"Aha!" I thought. That definitely looks much better. Less gap between what glibc says it requested from the system and the RSS size. And, more importantly, no runaway increase of memory usage in the middle of nowhere.
I was preparing myself to write a post about how mixing allocators could have unintended consequences. As a comparison point, I went ahead and ran another test, with the python allocator entirely disabled, this time.
Heh. It turns out glibc was acting up all alone. So much for my (plausible) theory. (I still think mixing allocators can have unintended consequences.)
(Note, however, that the reason why the python allocator exists is valid: without it, the overall clone took almost 10 more minutes)
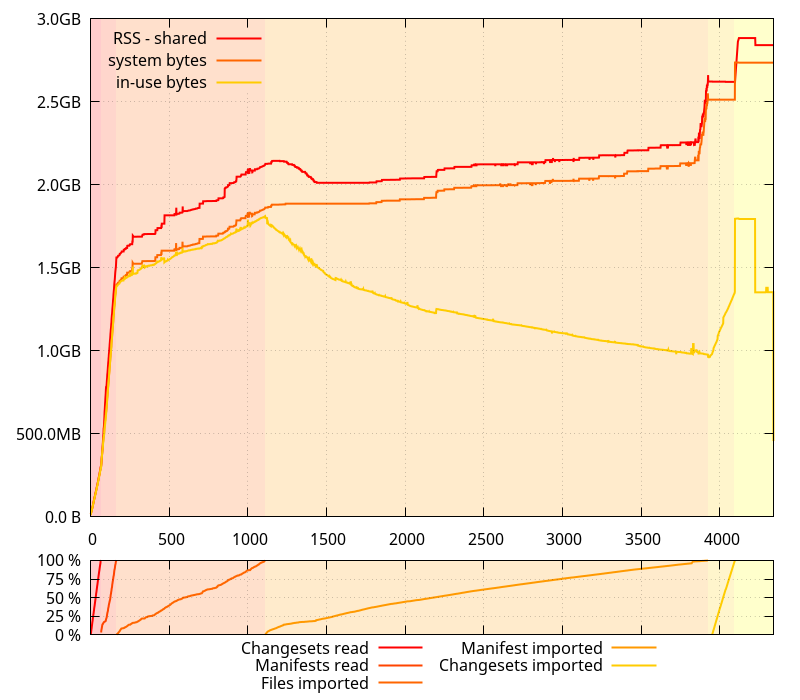
And since I had been getting all this data with 0.4.0, I gathered new data without the python allocator with the master branch.
This paints a rather different picture than the original data on that branch, with much less memory use regression than one would think. In fact, there isn't much difference, except for the spike at the end, which got worse, and some of the noise during the "Import manifests" phase that got bigger, implying larger amounts of temporary memory used. The latter may contribute to the allocation patterns that throw glibc's memory allocator off.
It turns out tracking memory usage in python 2.7 is rather painful, and not all the tools paint a complete picture of it. I hear python 3.x is somewhat better in that regard, and I hope it's true, but at the moment, I'm stuck with 2.7. The most reliable tool I've used here, it turns out, is pympler. Or rebuilding the python interpreter without its allocator, and asking the system allocator what is allocated.
With all this data, I now have some defined problems to tackle, some easy (the spike at the end of the clone), and some less easy (working around glibc allocator's behavior). I have a few hunches as to what kind of allocations are causing the runaway increase of RSS. Coincidentally, I'm half-way through a refactor of the code dealing with manifests, and it should help dealing with the issue.
But that will be the subject of a subsequent post.
2017-03-12 10:47:12+0900
Responses are currently closed, but you can trackback from your own site.

2017-03-12 17:42:21+0900
Try LD_PRELOADing tcmalloc (or maybe jemalloc).
tl;dr version is that glibc uses sbrk more often and ends up not being able to return freed memory to the OS.
Those libraries use mmap more often and are able to return the freed memory.
2017-03-13 03:37:22+0900
http://man7.org/linux/man-pages/man3/mallopt.3.html
Take a look at M_MMAP_THRESHOLD. (You may also need to adjust M_MMAP_MAX if you change the threshold.)
2017-03-13 04:36:52+0900
The best tool for tracking Python memory allocations is pytracemalloc. If you’re on Python 2.7 you’ll need to apply a small patch to the CPython source code and rebuild the interpreter.
http://pytracemalloc.readthedocs.io/
2017-03-13 08:26:35+0900
@a per Josh Triplett’s link, the default for the glibc allocator is to use mmap for allocations larger than 128KB. I’m actually expecting the allocations that cause the runaway increase to be much larger than that.
LD_PRELOADing tcmalloc or jemalloc, while I’m pretty sure it would work around the issue, is however not something I can tell users to do.
@Evan Klitzke: Thanks, it looks like this is what is natively in Python 3, nowadays, so I guess that’s what I was hearing is the good stuff. However, keeping frames for each allocation (even just one) sounds like something that would make memory use explode when your memory use is already high…
2017-03-22 21:46:52+0900
Great writeup. I’m very curious why exclusive use of the glibc allocator results in a longer runtime. Though an mmap with O(1) lookups for something like a slab allocator are always going to be faster than a true malloc API and the requirements it has. I’d still be curious if the new upstream glibc thread-local cache might eventually help this situation.