When the memory allocator works against you, part 2
This is a followup to the "When the memory allocator works against you" post from a few days ago. You may want to read that one first if you haven't, and come back. In case you don't or didn't read it, it was all about memory consumption during a git clone of the mozilla-central mercurial repository using git-cinnabar, and how the glibc memory allocator is using more than one would expect. This post is going to explore how/why it's happening.
I happen to have written a basic memory allocation logger for Firefox, so I used it to log all the allocations happening during a git clone exhibiting the runaway memory increase behavior (using a python that doesn't use its own allocator for small allocations).
The result was a 6.5 GB log file (compressed with zstd ; 125 GB uncompressed!) with 2.7 billion calls to malloc, calloc, free, and realloc, recorded across (mostly) 2 processes (the python git-remote-hg process and the native git-cinnabar-helper process ; there are other short-lived processes involved, but they do less than 5000 calls in total).
The vast majority of those 2.7 billion calls is done by the python git-remote-hg process: 2.34 billion calls. We'll only focus on this process.
Replaying those 2.34 billion calls with a program that reads the log allowed to reproduce the runaway memory increase behavior to some extent. I went an extra mile and modified glibc's realloc code in memory so it doesn't call memcpy, to make things faster. I also ran under setarch x86_64 -R to disable ASLR for reproducible results (two consecutive runs return the exact same numbers, which doesn't happen with ASLR enabled).
I also modified the program to report the number of live allocations (allocations that haven't been freed yet), and the cumulated size of the actually requested allocations (that is, the sum of all the sizes given to malloc, calloc, and realloc calls for live allocations, as opposed to what the memory allocator really allocated, which can be more, per malloc_usable_size).
RSS was not tracked because the allocations are never filled to make things faster, such that pages for large allocations are never dirty, and RSS doesn't grow as much because of that.
Full disclosure: it turns out the "system bytes" and "in-use bytes" numbers I had been collecting in the previous post were smaller than what they should have been, and were excluding memory that the glibc memory allocator would have mmap()ed. That however doesn't affect the trends that had been witnessed. The data below is corrected.
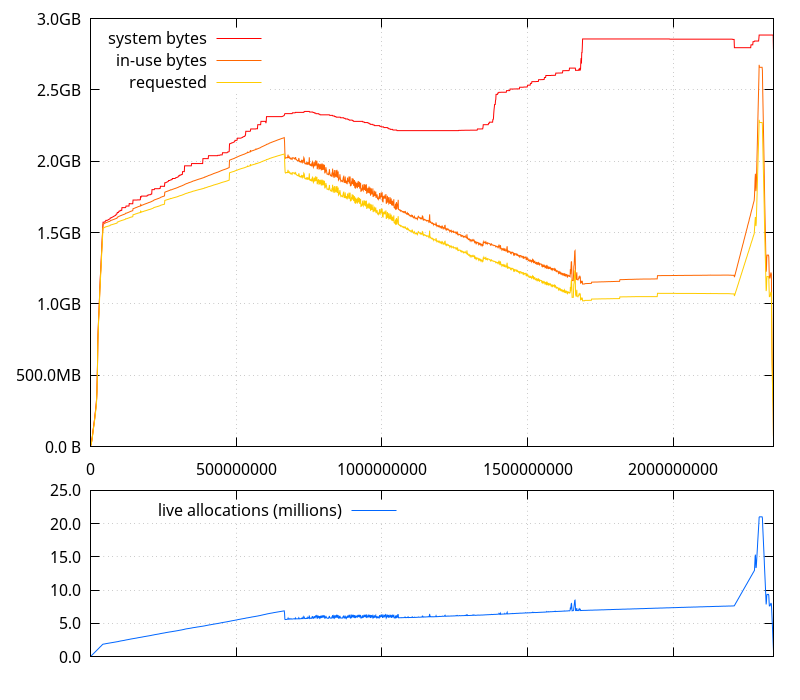
(Note that in the graph above and the graphs that follow, the horizontal axis represents the number of allocator function calls performed)
While I was here, I figured I'd check how mozjemalloc performs, and it has a better behavior (although it has more overhead).
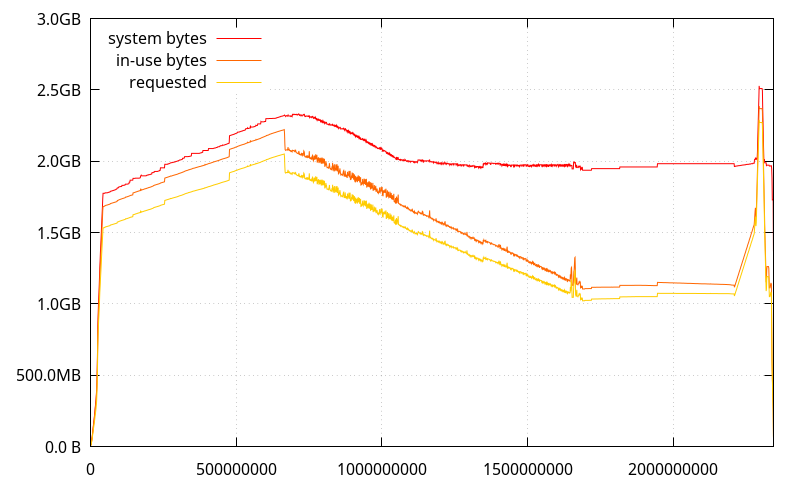
What doesn't appear on this graph, though, is that mozjemalloc also tells the OS to drop some pages even if it keeps them mapped (madvise(MADV_DONTNEED)), so in practice, it is possible the actual RSS decreases too.
And jemalloc 4.5:
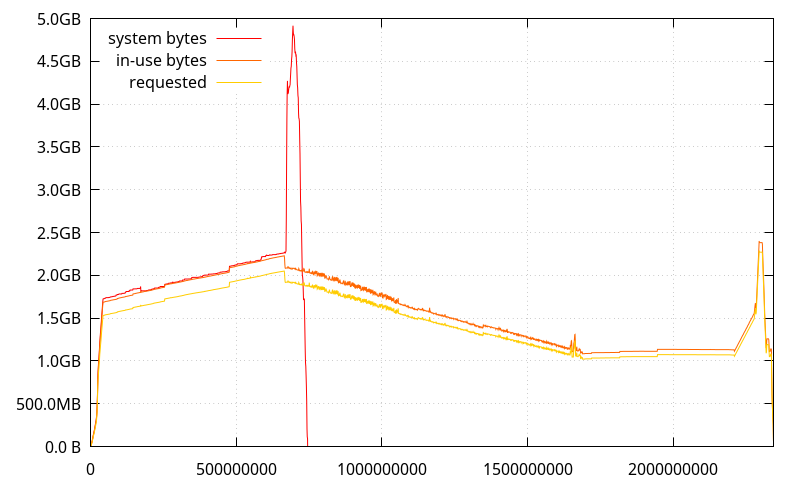
(It looks like it has better memory usage than mozjemalloc for this use case, but its stats are being thrown off at some point, I'll have to investigate)
Going back to the first graph, let's get a closer look at what the allocations look like when the "system bytes" number is increasing a lot. The highlights in the following graphs indicate the range the next graph will be showing.
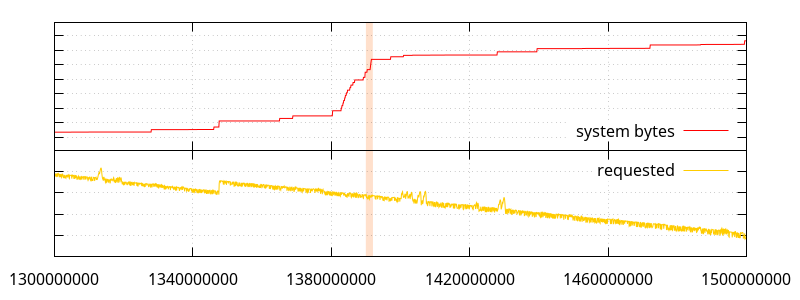
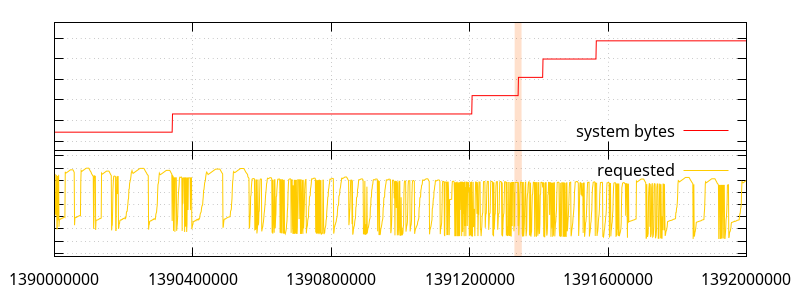
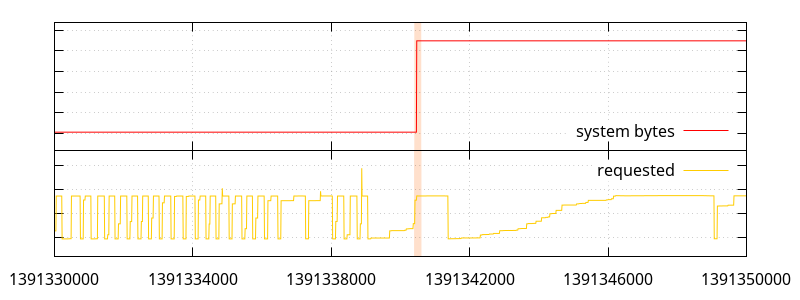
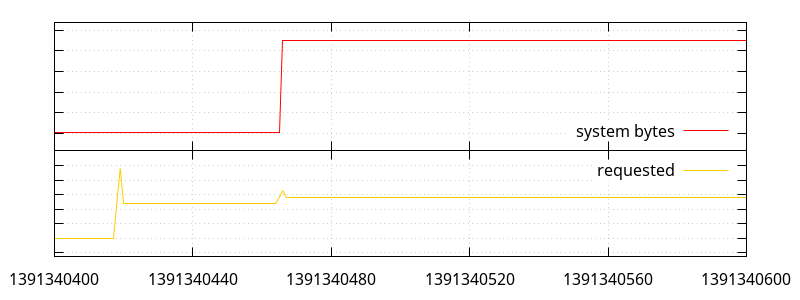
So what we have here is a bunch of small allocations (small enough that they don't seem to move the "requested" line ; most under 512 bytes, so under normal circumstances, they would be allocated by python, a few between 512 and 2048 bytes), and a few large allocations, one of which triggers a bump in memory use.
What can appear weird at first glance is that we have a large allocation not requiring more system memory, later followed by a smaller one that does. What the allocations actually look like is the following:
void *ptr0 = malloc(4850928); // #1391340418
void *ptr1 = realloc(some_old_ptr, 8000835); // #1391340419
free(ptr0); // #1391340420
ptr1 = realloc(ptr1, 8000925); // #1391340421
/* ... */
void *ptrn = malloc(879931); // #1391340465
ptr1 = realloc(ptr1, 8880819); // #1391340466
free(ptrn); // #1391340467
As it turns out, inspecting all the live allocations at that point, while there was a hole large enough to do the first two reallocs (the second actually happens in place), at the point of the third one, there wasn't a large enough hole to fit 8.8MB.
What inspecting the live allocations also reveals, is that there is a large number of large holes between all the allocated memory ranges, presumably coming from previous similar patterns. There are, in fact, 91 holes larger than 1MB, 24 of which are larger than 8MB. It's the accumulation of those holes that can't be used to fulfil larger allocations that makes the memory use explode. And there aren't enough small allocations happening to fill those holes. In fact, the global trend is for less and less memory to be allocated, so, smaller holes are also being poked all the time.
Really, it's all a straightforward case of memory fragmentation. The reason it tends not to happen with jemalloc is that jemalloc groups allocations by sizes, which the glibc allocator doesn't seem to be doing. The following is how we got a hole that couldn't fit the 8.8MB allocation in the first place:
ptr1 = realloc(ptr1, 8880467); // #1391324989; ptr1 is 0x5555de145600
/* ... */
void *ptrx = malloc(232); // #1391325001; ptrx is 0x5555de9bd760 ; that is 13 bytes after the end of ptr1.
/* ... */
free(ptr1); // #1391325728; this leaves a hole of 8880480 bytes at 0x5555de145600.
All would go well if ptrx was free()d, but it looks like it's long-lived. At least, it's still allocated by the time we reach the allocator call #1391340466. And since the hole is 339 bytes too short for the requested allocation, the allocator has no other choice than request more memory to the system.
What's bothering, though, is that the allocator chose to allocate ptrx in the space following ptr1, when it allocated similarly sized buffers after allocating ptr1 and before allocating ptrx in completely different places, and while there are plenty of holes in the allocated memory where it could fit.
Interestingly enough, ptrx is a 232 bytes allocation, which means under normal circumstances, python itself would be allocating it. In all likeliness, when the python allocator is enabled, it's allocations larger than 512 bytes that become obstacles to the larger allocations. Another possibility is that the 256KB fragments that the python allocator itself allocates to hold its own allocations become the obstacles (my original hypothesis). I think the former is more likely, though, putting back the blame entirely on glibc's shoulders.
Now, it looks like the allocation pattern we have here is suboptimal, so I re-ran a git clone under a debugger to catch when a realloc() for 8880819 bytes happens (the size is peculiar enough that it only happened once in the allocation log). But doing that with a conditional breakpoint is just too slow, so I injected a realloc wrapper with LD_PRELOAD that sends a SIGTRAP signal to the process, so that an attached debugger can catch it.
Thanks to the support for python in gdb, it was then posible to pinpoint the exact python instructions that made the realloc() call (it didn't come as a surprise ; in fact, that was one of the places I had in mind, but I wanted definite proof):
new = ''
end = 0
# ...
for diff in RevDiff(rev_patch):
    new += data[end:diff.start]
    new += diff.text_data
    end = diff.end
    # ...
new += data[end:]
What happens here is that we're creating a mercurial manifest we got from the server in patch form against a previous manifest. So data contains the original manifest, and rev_patch the patch. The patch essentially contains instructions of the form "replace n bytes at offset o with the content c".
The code here just does that in the most straightforward way, implementation-wise, but also, it turns out, possibly the worst way.
So let's unroll this loop over a couple iterations:
new = ''
This allocates an empty str object. In fact, this doesn't actually allocate anything, and only creates a pointer to an interned representation of an empty string.
new += data[0:diff.start]
This is where things start to get awful. data is a str, so data[0:diff.start] creates a new, separate, str for the substring. One allocation, one copy.
Then appends it to new. Fortunately, CPython is smart enough, and just assigns data[0:diff.start] to new. This can easily be verified with the CPython REPL:
>>> foo = ''
>>> bar = 'bar'
>>> foo += bar
>>> foo is bar
True
(and this is not happening because the example string is small here ; it also happens with larger strings, like 'bar' * 42000)
Back to our loop:
new += diff.text_data
Now, new is realloc()ated to have the right size to fit the appended text in it, and the contents of diff.text_data is copied. One realloc, one copy.
Let's go for a second iteration:
new += data[diff.end:new_diff.start]
Here again, we're doing an allocation for the substring, and one copy. Then new is realloc()ated again to append the substring, which is an additional copy.
new += new_diff.text_data
new is realloc()ated yet again to append the contents of new_diff.text_data.
We now finish with:
new += data[new_diff.end:]
which, again creates a substring from the data, and then proceeds to realloc()ate new one freaking more time.
That's a lot of malloc()s and realloc()s to be doing...
- It is possible to limit the number of
realloc()s by usingnew = bytearray()instead ofnew = ''. I haven't looked in the CPython code what the growth strategy is, but, for example, appending a 4KB string to a 500KBbytearraymakes it grow to 600KB instead of 504KB, like what happens when usingstr. - It is possible to avoid
realloc()s completely by preallocating the right size for thebytearray(withbytearray(size)), but that requires looping over the patch once first to know the new size, or using an estimate (the new manifest can't be larger than the size of the previous manifest + the size of the patch) and truncating later (although I'm not sure it's possible to truncate abytearraywithout arealloc()). As a downside, this initializes the buffer with null bytes, which is a waste of time. - Another possibility is to reuse
bytearrays previously allocated for previous manifests. - Yet another possibility is to accumulate the strings to append and use
''.join(). CPython is smart enough to create a single allocation for the total size in that case. That would be the most convenient solution, but see below. - It is possible to avoid the intermediate allocations and copies for substrings from the original manifest by using
memoryview. - Unfortunately, you can't use
''.join()on a list ofmemoryviews before Python 3.4.
After modifying the code to implement the first and fifth items, memory usage during a git clone of mozilla-central looks like the following (with the python allocator enabled):
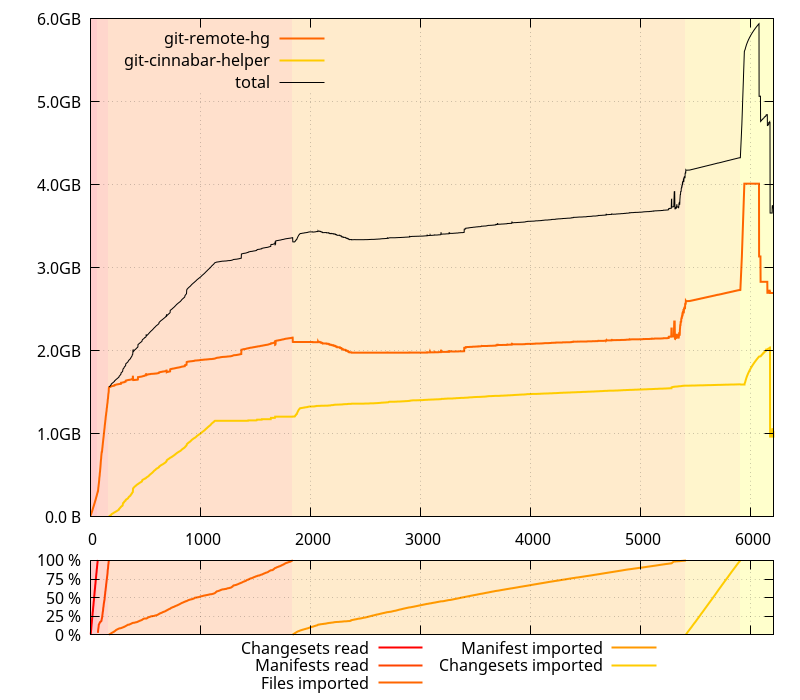
(Note this hasn't actually landed on the master branch yet)
Compared to what it looked like before, this is largely better. But that's not the only difference: the clone was also about 1000 seconds faster. That's more than 15 minutes! But that's not all so surprising when you know the volumes of data handled here. More insight about this coming in an upcoming post.
But while the changes outlined above make the glibc allocator behavior less likely to happen, it doesn't totally obliviate it. In fact, it seems it is still happening by the end of the manifest import phase. We're still allocating increasingly large temporary buffers because the size of the imported manifests grows larger and larger, and every one of them is the result of patching a previous one.
The only way to avoid those large allocations creating holes would be to avoid doing them in the first place. My first attempt at doing that, keeping manifests as lists of lines instead of raw buffers, worked, but was terribly slow. So slow, in fact, that I had to stop a clone early and estimated the process would likely have taken a couple days. Iterating over multiple generators at the same time, a lot, kills performance, apparently. I'll have to try with significantly less of that.
2017-03-22 15:57:46+0900
Responses are currently closed, but you can trackback from your own site.

2017-03-22 21:50:00+0900
Upstream glibc has been working on a process to allow us to record and replay in a simulator a memory allocation workload in order to study it in more detail under different conditions. This way you can avoid doing a complex operation if the recorded workload exposes the problem. It is just like your tool a high-speed malloc API tracer, it’s MT-safe and very fast, and conceptually very similar to LTTng-ust. The only benefit we have is that we inline the trace record creation directly into the malloc API, but require you use an instrumented glibc.
The Red Hat glibc team presented a talk at Linux Plumbers Conference 2016 about the idea and how we were using it to look at customer workloads “linux and glibc: The 4.5TiB malloc API trace”. As you can see from the title this kind of high-speed API call trace takes up a lot of data.
https://linuxplumbersconf.org/2016/ocw/system/presentations/3921/original/LPC%202016%20-%20linux%20and%20glibc_%20The%204.5TiB%20malloc%20API%20trace.pdf
2017-03-22 22:44:14+0900
You note: “What’s bothering, though, is that the allocator chose to allocate ptrx in the space following ptr1, when it allocated similarly sized buffers after allocating ptr1 and before allocating ptrx in completely different places, and while there are plenty of holes in the allocated memory where it could fit.”
For reference:
https://sourceware.org/glibc/wiki/MallocInternals
(a) Why do allocations go to the same place?
A given thread will always look for memory within a given heap and associated arena. The goal is for the thread and the arena (and it’s collection of heaps) to be tightly coupled with the thread, this roughly emulates per-CPU allocations which aims to have optimal performance cache-wise and in NUMA scenarios. Eventually we really want userspace restartable sequences that let us call getcpu() without racing and pick real per-cpu chunks.
(b) Could an arena and it’s heaps be grouped physically by size?
Yes. We don’t currently do this in glibc’s malloc. The heap-based allocator logically groups fastbins, smallbins, largebins, and unsorted entries, but doesn’t group all of them physically in any special areas of the heap. Therefore you can get fragmentation if you alternate large and small allocations (this isn’t quite true since fastbins are logically grouped at the top of the heap, but they are quite small). This might help alleviate fragmentation between the size groups like that which happens with page-based allocators (glibc is heap-based).
(c) Lifetimes.
The allocator doesn’t have any idea how long your allocations will be alive for and if you do mix small long-lived allocations with large short lived allocations it’s quite a recipe for fragmentation.
You might do well to call malloc_trim() in some places to do deeper page-based trimming. The linux man page needs an update since it says trimming can only happen from the top of the heap (sbrk) and that’s only true for the main arena. Other threads using mmap’d arenas and heaps can do page-based deep trimming using MADV_DONTNEED (which does immediately decrease RSS accounting).
In summary:
I think upstream glibc would be open to suggestions for how to handle this kind of operation more efficiently. Particularly if you can provide a microbenchmark that shows what you want to discuss.
Looking at tcmalloc and jemalloc, they are page-based allocators that handle page lists, and that has different external fragmentation characteristics as opposted to glibc’s healp-based allocator.
One thing that nobody has ever asked glibc is to set a limit to how much the allocator caches in userspace. It’s becoming common to run in resource constrained containers and VMs and people want assurances about how much memory you’re going to use. This is something we probably need to look at in more detail.
2017-03-23 09:20:43+0900
@Carlos O’Donell This is not a page-based vs. heap-based issue. In fact, jemalloc can use sbrk() too. This is an issue of how allocations are being fulfilled. Jemalloc uses runs of allocation sizes. So if you allocate many objects of the same size, they will very likely be in the same run. Different sizes will go in different runs. Glibc just doesn’t care very much. And apparently prefers to use the end of the heap for allocations when it could have used existing holes in the heap.
2018-12-16 07:36:08+0900
This is weird. Glibc normally allocates small allocations (less than 128 kB) vie sbrk and large allocations via mmap. The large allocations are always rounded up to a page boundary so that they can be individually munmap’ed again. So how did a 232 byte allocaton end up immediately after a 8880467 byte allocation, sharing its last page? Has MMAP_THRESHOLD been set to an unreasonably large value?