Archive for the 'p.d.o' Category

Knowing how much disk seeks hurt

We all know disk seeks hurt. But we usually don't have a precise idea how much. How about getting that idea?

Here is a little experiment I ran a few days ago. I took the output from the systemtap script tracking I/O I wrote, on a Firefox startup after boot. Each line of that output, which gives a timestamp (which we don't care about here), a file name, and an offset, represents a 4096 bytes read (one page).

The first set of data points I got is how much time it takes to reproduce this read pattern after a reboot, and how that compares to Firefox startup time. For what it's worth, I did group following reads, to avoid doing too many system calls, and also avoided kernel readahead by using direct I/O, meaning I would only read exactly what the kernel reads when Firefox normally starts.

All the following tests were done under the usual conditions (see previous posts), but I limited the tests to the x86-64 architecture, because all that really matters is the disk. I'll mention, however, that the amount of data read in these tests is 34,729,984 bytes, and that the original I/O pattern looks like this:

Zooming around the main location where most I/O happen, we can see the pattern is still bumpy:

This somehow looks familiar, doesn't it?

We already know for a fact that even these patterns that, on the whole disk, look like pretty much insignificant, have an important impact on startup time. Try to imagine what kind of difference could be observed if we were reordering all these reads.

Anyways, back to that I/O simulation, we first need to see how far it is from the actual Firefox startup. We would rather that simulated I/O + warm startup/hot cache end up close to the real thing. However, we need to keep in mind, as we saw in a previous post, that CPU scaling, when mixed with I/O, has an influence on startup time. Warm startup not involving I/O, the CPU can run at maximum speed the whole time. As such, for a fair comparison, we need to compare to cold startup time with the CPU forced at maximum speed, which we saw is faster than startup time with CPU scaling.

Average time (ms)
Simulated cold startup 2,764.26 ± 0.42%
Warm startup 250.74 ± 0.18%
Simulated cold + warm 3015
Real cold startup 3087.47 ± 0.31%
Difference 72.47 (2.35%)

Close enough, I'd say. The difference is most probably caused by metadata reads and a few other things, that isn't in the systemtap script scope.

Now we know our simulated I/O is close to reality, what happens if we reorder all these reads according to the position on disk?

Average time (ms) Corresponding transfer rate
Simulated I/O 2,764.26 ± 0.42% 12.56 MB/s
Reordered I/O 1,473.34 ± 0.43% 23.57 MB/s
Difference 1,290.92 (46.7%) n/a

That's almost twice as fast ! And the disk doesn't even have a big throughput (around 30MB/s). Let's see what it does with a disk with a bigger throughput (85MB/s).

Average time (ms) Corresponding transfer rate
Simulated I/O 1,898.66 ± 0.16% 18.29 MB/s
Reordered I/O 644.0 ± 0.15% 53.93 MB/s
Difference 1,254.66 (66.08%) n/a

That's almost three times as fast ! The faster the disk, the bigger the improvement we can get by reordering and grouping I/O, which is not unexpected, but here we can see how much having to go back and forth on the disk hurt badly. Obviously, the numbers from the faster disk can't be directly compared to the ones from the slower disk, because the data was not arranged the same way on the disk, and file system fragmentation, as well as how the file system is filled also have their own share to add to the problem.

And because it's more impressive to see on a graph than in a result table:

Disks seeks hurt. Badly.

2011-02-08 15:42:43+0900

p.d.o, p.m.o | 5 Comments »

Yet another clarification about Iceweasel

I'm glad that 5 years after the facts, people are still not getting them straight.

The Firefox logo was not under a free copyright license. Therefore, Debian was using the Firefox name with the "earth" logo (without the fox), which was and still is under a free copyright license. Then Mozilla didn't want the Firefox name associated to an icon that is not the Firefox icon, for trademark reasons. Fair enough.

Although at the time Debian had concerns with the trademark policy, there was no point arguing over it, since Debian was not going to use the logo under a non-free copyright license anyway.

Now, it happens that the logo has turned to a free copyright license. Request for a trademark license was filed a few weeks after we found out about the good news, and we are still waiting for an agreement draft from Mozilla to hopefully go forward.

It is still not certain that this will actually lead to Debian shipping something called Firefox some day, but things are progressing, even if at a rather slow pace, and I have good hope (discussions are promising).

By the way, thank you for the nice words, Daniel.

2011-02-07 20:42:47+0900

firefox, p.m.o | 7 Comments »

Dear lazyweb

I would like to replace my current blog with a system that mostly generates static pages, with support for comments. I'd like it to take files as input for blog posts (I'd like to store them in git), instead of database tables, and to have a flexible markup language (flexible in that it'd allow to customize the HTML output), and flexible templates.

Ikiwiki might come close to that, though I haven't looked into details. Dear lazyweb, would you know other software that'd fulfill my needs, or come close?

2011-01-16 10:12:53+0900

miscellaneous, p.d.o, p.m.o | 17 Comments »

Iceweaselボタンの代わりにアイコン

最近のIceweaselベータでメニューバーを隠して、その代わりにIceweaselボタンが表示されます。そうするにはメニューバーに右クリックして、メニューバーを無効にしたらIceweaselボタンが現れます。

あまり魅力的ではありませんし、タブバーの場所を無駄に取りますが、少しのCSSで変えられます。ユーザーのプロファイルのchrome/userChrome.cssに下記のCSSを追加して下さい:

#appmenu-toolbar-button {
  list-style-image: url("chrome://branding/content/icon16.png");
}
#appmenu-toolbar-button > .toolbarbutton-text,
#appmenu-toolbar-button > .toolbarbutton-menu-dropmarker {
  display: none !important;
}

それで、Iceweaselはこうなります:

2011-01-15 16:22:43+0900

firefox | No Comments »

Replacing the Iceweasel button with an icon

Recent Iceweasel betas allows to replace the menu bar with a Iceweasel button. This is not enabled by default, but right-clicking on the menu bar allows to disable the menu bar, which enables the Iceweasel button.

The button is not exactly very appealing, and takes quite a lot of horizontal space on the tab bar. But with a few lines of CSS, this can fortunately be changed. Edit the chrome/userChrome.css file under your user profile, and add the following lines:

#appmenu-toolbar-button {
  list-style-image: url("chrome://branding/content/icon16.png");
}
#appmenu-toolbar-button > .toolbarbutton-text,
#appmenu-toolbar-button > .toolbarbutton-menu-dropmarker {
  display: none !important;
}

This what Iceweasel looks like, then:

2011-01-15 15:49:20+0900

firefox | 20 Comments »

Debian Mozilla組のAPTリポジトリの変化

お久しぶりです。

Debianアーカイブでまだ配布出来ないパッケージの配布の仕方を変化させていただきました。これからは4.0ベータを利用するには下記のAPTのソースを追加してください:

deb http://mozilla.debian.net/ experimental iceweasel-4.0

Experimentalのリポジトリも必要ですので、APTのsources.listに追加してください。その設定で4.0ベータのインストールが下記の通りに簡単なはずです:

# apt-get install -t experimental iceweasel

Squeezeでもunstableでも利用出来るはずです。

Debian Lenny向けのIceweasel 3.6のbackportも配布します。インストールするには下記のAPTのソースを追加してください:

deb http://mozilla.debian.net/ lenny-backports iceweasel-3.6

Lenny-backportsのリポジトリも必要ですので、APTのsources.listに追加してください。Experimentalのようにインストールが下記の通りに簡単なはずです:

# apt-get install -t lenny-backports iceweasel

APTが公開鍵を利用出来ない場合は公開鍵をAPTキーリングに追加する説明を読んでみてください(英語)。

2011-01-14 17:36:41+0900

mozilla | No Comments »

Changes to the Debian Mozilla team APT archive

I made some changes as to how packages from the Debian Mozilla team that can't yet be distributed in the Debian archives are distributed to users. Please update your APT sources and now use the following for 4.0 beta packages:

deb http://mozilla.debian.net/ experimental iceweasel-4.0

You'll also need the experimental repository in your sources, but the overall installation is much easier now:

# apt-get install -t experimental iceweasel

This should work for squeeze and unstable users.

I also added Iceweasel 3.6 backports for Debian Lenny users. For these, add the following APT source:

deb http://mozilla.debian.net/ lenny-backports iceweasel-3.6

You'll also need the lenny-backports repository in your sources. As for the experimental packages above, installation should be as easy as:

# apt-get install -t lenny-backports iceweasel

If your APT complains about the archive key, please check the instructions to add the key to your APT keyring.

2011-01-14 10:25:48+0900

mozilla | 27 Comments »

Attempting to track I/O with systemtap

There are several ways a program can hit the disk, and it can be hard to know exactly what's going on, especially when you want to take into account the kernel caches. This includes, but is not limited to:

  • any access to a file, which may lead to I/O to read its parent directories if they are not already in the inode or dentry caches
  • enumerating a directory with readdir(), which may lead to I/O on the directory for the same reason
  • read()/write() on a file, which may lead to I/O on the file if it is not in the page cache
  • accesses in a mmap()ed area of memory, which may lead to I/O on the underlying file if it is not in the page cache
  • etc.

There are various ways to track system calls (e.g. strace) allowing to track what a program is doing with files and directories, but that doesn't tell you if you're actually hitting the disk or not. There are also various ways to track block I/O (e.g. blktrace) allowing to track actual I/O on the block devices, but it is then hard to back-track what part of which files or directories these I/O relate to. To the best of my knowledge, there are unfortunately no tools to do such tracking easily.

Systemtap, however, allows to access the kernel's internals and to gather almost any kind of information from any place in a running kernel. The downside is that it means you need to know how the kernel works internally to gather the data you need ; that will limit the focus of this post.

I had been playing, in the past, with Taras' script, which he used a while ago to track I/O during startup. Unfortunately, it became clear something was missing in the picture, so I had to investigate what's going on in the kernel.

Setting up systemtap

On Debian systems, you need to install the following packages:

  • systemtap
  • linux-image-2.6.x-y-$arch-dbg (where x, y, and $arch correspond to the kernel package you are using)
  • linux-headers-2.6.x-y-$arch (likewise)
  • make

That should be enough to pull all the required dependencies. You may want to add yourself to the stapdev and stapusr groups, if you don't want to run systemtap as root. If, like in my case, you don't have enough space left for all the files in /usr/lib/debug, you can trick dpkg into not unpacking files you don't need:

# echo path-exclude /usr/lib/debug/lib/modules/*/kernel/drivers/* > /etc/dpkg/dpkg.cfg.d/kernel-dbg

The file in /etc/dpkg/dpkg.cfg.d can obviously be named as you like, and you can adjust the path-exclude pattern to what you (don't) want. In the above case, kernel drivers debugging symbols will be ignored. Please note that this feature requires dpkg version 1.15.8 or greater.

Small digression

One of the first problems I had with Taras' script is that systemtap would complain that it doesn't know the kernel.function("ext4_get_block") probe. It is due to a very unfortunate misfeature of systemtap, where the kernel.* probes refer to whatever is in the vmlinux image. Modules probes have a separate namespace, namely module("name").*.

So for the ext4_get_block() function, this means you need to set a probe for either kernel.function("ext4_get_block") or module("ext4").function("ext4_get_block"), depending how your kernel was compiled. And you can't even use both in your script, because systemtap will complain about either being an unknown probe...

Tracking the right thing

I was very recently pointed to a Red Hat document containing 4 useful systemtap scripts ported from dtrace, which gives me a good occasion to explain the issue at hand with the first of these scripts.

This script attempts to track I/O by following read() and write() system calls. Which is not tracking I/O, it is merely tracking some system calls (Taras' script had the same kind of problem with read()/write() induced I/O). You could just do the very same with existing tools like strace, and that wouldn't even require some system privileges.

To demonstrate the script doesn't actually track the use of storage devices as the document claims, consider the following source code:

#include <fcntl.h>
#include <sys/stat.h>
#include <unistd.h>

/* Ensure the resulting binary is decently sized */
const char dummy[1024 * 1024] = "a";

int main(int argc, char *argv[]) {
  struct stat st;
  char buf[65536];
  int i, fd = open(argv[0], O_RDONLY);
  for (i = 0; i < 100000; i++) {
    read(fd, buf, 65536);
    lseek(fd, 0, SEEK_SET);
    read(fd, buf, 65536);
    lseek(fd, 512 * 1024, SEEK_SET);
  }
  close(fd);
  return 0;
}

All it does is reading some parts of the executable a lot of times (notice the trick to make the executable size at least 1MB). Not a lot of programs will actually do something as bold as reading the same data again and again (though we could probably be surprised), but this easily points the problem. Here is what the output of the systemtap script looks like for this program (stripping other unrelevant processes):

         process     read   KB tot    write   KB tot
            test   400002 25600001        0        0

Now, do you really believe 25MB have actually been read from the disk? (Note that the read() count seems odd as well, as there should only be around 200000 calls)

Read-ahead, page cache and mmap()

What the kernel actually does is that a read() on a file is going to check the page cache first. If there is nothing corresponding to the read() request in the page cache, then it goes down to the disk, and fills page cache. But as loading only a few bytes or kilobytes from the disk could be wasteful, the kernel also reads a few more blocks ahead, apparently with some heuristic.

But read() and write() aren't the sole way a program may hit the disk. On UNIX systems, a file can be mapped in memory with the mmap() system call, and all accesses in the memory range corresponding to this mapping will be reflected on the file. There are exceptions, depending on how the mapping is established, but let's keep it simple. There is a lot of litterature on the subject if you want to document yourself on mmap().

The way the kernel will read from the file, however, is quite similar to that of read(), and uses page cache and read ahead. The systemtap script debunked above doesn't track these.

I'll skip write accesses, because for now, they haven't been in my scope.

Tracking some I/O with systemtap

What I've been trying to track so far has been limited to disk reads, which happen to be the only accesses occurring on shared library files. Programs and shared libraries are first being read() from, so that the dynamic linker gets the ELF headers and knows what to load, and then are mmap()ed following PT_LOAD entries in these headers.

As far as my investigation in the Linux kernel code goes, fortunately, both accesses, before they end up actually hitting the disk, go through the __do_page_cache_readahead kernel function (this function was tracked in Taras' script). Unfortunately, while it is called with an offset and a number of pages to read for a given file, it turns out the last pages in that number are not necessarily being read from the disk. I don't know for sure, because the latter had an effect on my observations, but some might even already be in the page cache.

Going further down, we reach the VFS layer, which ends up being file-system specific. But fortunately, a bunch of (common) file-systems actually share page mapping code, and commonly use the mpage_readpage and mpage_readpages functions, both calling do_mpage_readpage to do the actual work. And this function seems to be properly called only once for each page not in the page cache already.

If my reading of the kernel source is right, this however is not really where it ends, and do_mpage_readpage doesn't actually hit the disk. It seems to only gather some information (basically, a mapping between storage blocks and memory) that is going to be submitted to the block I/O layer, which itself may do some fancy stuff with it, such as reordering the I/Os depending on other requests it got from other processes, the position of the disk heads, etc.

And when I say do_mpage_readpage doesn't actually hit the disk, I'm again simplifying the issue, because it actually might, as there might be a need to read some metadata from the disk to know where some blocks are located. But tracking metadata reads is much harder, and I haven't investigated it.

Anyways, skipping metadata, going further down after do_mpage_readpage is hard because it's difficult to back-track which block I/O is related to which read-ahead, corresponding to what read at what position in which file. do_mpage_readpage already has part of this problem because it is not called with any reference to the corresponding file. But __do_page_cache_readahead is.

So knowing all the above, here is my script, the one I used to get the most recent Firefox startup data you can find in my last posts:

global targetpid;
global file_path;

probe begin {
  targetpid = target();
}

probe kernel.function("__do_page_cache_readahead") {
  if (targetpid == pid())
    file_path[tid()] = d_path(&$filp->f_path);
}

probe kernel.function("do_mpage_readpage") {
  if (targetpid == pid() && (tid() in file_path)) {
    now = gettimeofday_us();
    printf("%d %s %d\n", now, file_path[tid()], $page->index*4096);
  }
}

probe kernel.function("__do_page_cache_readahead").return {
  if (targetpid == pid())
    delete file_path[tid()];
}

This script needs to be used with a command given to systemtap, with the -c option, such as in the following command line:

# stap readpage.stp -c firefox

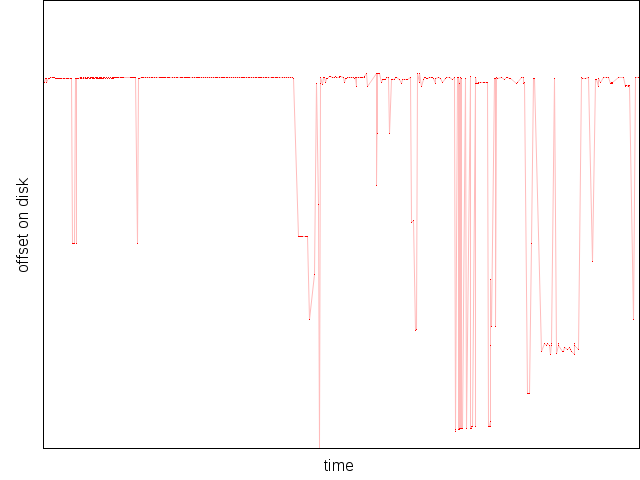
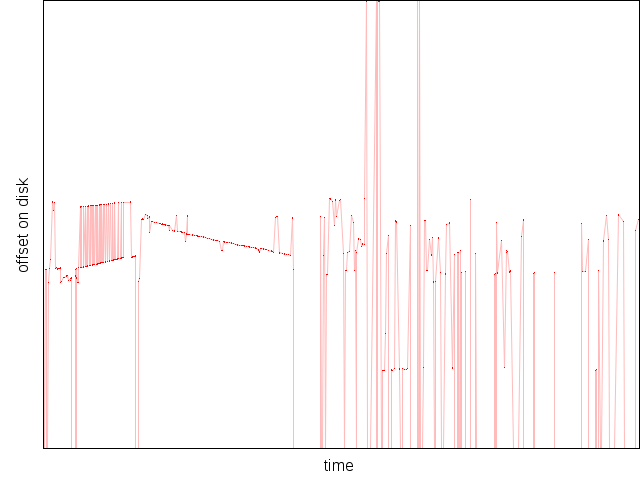
Each line of output represents a page (i.e. 4,096 bytes) being read, and contains a timestamp, the name of the file being read, and the offset in the file. As discussed above, do_mpage_readpage is not really the place the I/O actually occurs, so the timestamps are not entirely accurate, and the actual read order from disk might be slightly different, but it still is a quite reliable view in that the result should be reproducible with the same files even when they're not located on the same blocks on disk, and provided their page cache status is the same when starting the program.

This systemtap script ignores writes, as well as metadata accesses (including but not limited to inodes, dentries, bitmap blocks and indirect blocks). It also doesn't account accesses to files opened with the O_DIRECT flag or similar constructs (raw devices, etc.)

Read-ahead in action

Back to the small example program, my systemtap script records 102 page accesses, that is, 417,792 bytes, much less than the actual binary size on my system (1,055,747 bytes). We are still far from the 25MB figure from the other systemtap script. But we are also far from the 128KiB the program actively reads (64KiB twice, leaving a hole between the two blocks).

At this point, it is important to note that the ELF headers and program code all fit within a single page (4 KiB), and following the 1MiB section corresponding to the dummy variable, there are only 5,219 bytes of other ELF sections, including the .dynamic section. So even counting everything the dynamic linker needs to read, and the program code itself, we're still far from what my systemtap script records.

Grouping consecutive blocks with consecutive timestamps, here is what can be observed:

Offset Length
0 16,384
983,040 73,728
16,384 262,144
524,288 65,536

(By now, you should have guessed why I wanted that big hole between the read()s ; if you want to reproduce at home, I suggest you also use my page cache flush helper)

As earlier investigations showed, the first accesses by the dynamic loader are to read the ELF headers and .dynamic section. As mentioned above, these are really small. Yet, the kernel actually reads much more: 16KiB at the beginning of the file when reading the ELF headers, and 72KiB at the end when reading the .dynamic section. Subsequent accesses from the dynamic loader are obviously already covered by these accesses.

Next accesses are those due to the program itself. The program actively reads 64KiB at the beginning of the file, then 64KiB starting at offset 524,288. For the first read, the kernel already had 16KiB in the page cache, so it didn't read them again, but instead of reading the remainder, it reads 256KiB. For the second read, however, it only reads the requested 64KiB.

As you can see, this is far from being something like "you wanted n KiB, I'll read that fixed amount now".

Further testing with different read patterns (e.g. changing the hole size, read size, or reading from the dummy variable directly instead of read()ing the binary) is left as an exercise to the reader.

2011-01-12 20:55:56+0900

p.d.o, p.m.o | 8 Comments »

The measured effect of I/O on application startup

I did some experiments with the small tool I wrote in previous post in order to gather some startup data about Firefox. It turns out it can't flush directories and other metadata from the page cache, making it unfortunately useless for what I'm most interested in.

So, I gathered various startup information about Firefox, showing how page cache (thus I/O) has a huge influence on startup. The data in this post are mean times and 95% confidence interval for 50 startups with an existing but fresh profile, in a mono-processor GNU/Linux x86-64 virtual machine (using kvm) with 1GB RAM and a 10GB raw hard drive partition over USB, running, except when said otherwise, on an i7 870 (up to 3.6GHz with Intel Turbo Boost). The Operating System itself is an up-to-date Debian Squeeze running the default GNOME environment.

Firefox startup time is measured as the difference between the time in ms right before starting Firefox and time in ms as returned by javascript in a data:text/html page used as home page.

Startup vs. page cache

Average startup time (ms)
Entirely cold cache (drop_caches) 5887.62 ± 0.88%
Cold cache after boot 3382.0 ± 0.51%
Selectively cold cache (see below) 2911.46 ± 0.48%
Hot cache (everything previously in memory) 250.74 ± 0.18%

The selectively cold cache case makes use of the flush program from previous post and a systemtap script used to get the list of files read during startup. This script will be described in a separate post.

As you can see, profiling startup after echo 3 > /proc/sys/vm/drop_caches takes significantly more time than in the normal conditions users would experience, because of all system libraries that would normally be in the page cache being flushed, hence biasing the view one can have of the actual startup performance. Mozilla build bots were running, until recently, a ts_cold startup test that, as I understand it, had this bias (which is part of why it was stopped).

The Hot cache value is also interesting because it shows that the vast majority of cold startup time is due to hard disk I/O (and no, there is no page faults number difference).

I/O vs CPU

Interestingly, testing on a less beefy machine (Core 2 Duo 2.2GHz) with the same USB disk and kvm setup shows something not entirely intuitive:

Average (ms)
Entirely cold cache 6748.42 ± 1.01%
Cold cache after boot 3973.64 ± 0.53%
Selectively cold cache 3445.7 ± 0.43%
Hot cache 570.58 ± 0.70%

I, for one, would have expected I/O bound startups to only be slower by around 320ms, which is roughly the hot cache startup difference, or, in other words, the CPU bound startup difference. But I figured I was forgetting an important factor.

I/O vs. CPU scaling

Modern processors do frequency scaling, which allows the processor to run slowly when underused, and faster when used, thus saving power. It was first used on laptop processors to reduce power drawn from the battery, allowing batteries to last longer, and is now used on desktop processors to reduce power consumption. It unfortunately has a drawback, in that it introduces some latency when the scaling kicks in.

A not so nice side effect of frequency scaling is that when a process is waiting for I/O, the CPU is underused, making the CPU usually run at its slowest frequency. When the I/O ends and the process runs again, the CPU can go back to full speed. This means every I/O can induce, on top of latency because of, e.g. disk seeks, CPU scaling latency. And it actually has much more impact than I would have thought.

Here are results on the same Core 2 Duo, with frequency scaling disabled, and the CPU forced to its top speed :

Average (ms)
Entirely cold cache 5824.1 ± 1.13%
Cold cache after boot 3441.8 ± 0.43%
Selectively cold cache 3025.72 ± 0.29%
Hot cache 576.88 ± 0.98%

(I would have liked to do the same on the i7, but Intel Turbo Boost complicates things and I would have needed to get two new sets of data)

Update: I actually found a way to force one core at its max frequency and run kvm processes on it, giving the following results:

Average (ms)
Entirely cold cache 5395.94 ± 0.83%
Cold cache after boot 3087.47 ± 0.31%
Selectively cold cache 2673.64 ± 0.21%
Hot cache 258.52 ± 0.35%

I haven't gathered enough data to have accurate figures, but it also seems that forcing the CPU frequency to a fraction of the fastest supported frequency gives the intuitive results where the difference between all I/O bound startup times is the same as the difference for hot cache startup times. As such, I/O bound startup improvements would be best measured as an improvement in the difference between cold and hot cache startup times, i.e. (cold2 - hot2) - (cold1 - hot1), at a fixed CPU frequency.

Startup vs. desktop environment

We saw above that the amount of system libraries in page cache directly influences application startup times. And not all GNU/Linux systems are made equal. While the above times were obtained under a GNOME environment, some other desktop environments don't use the same base libraries, which can make Firefox require to load more of them at cold startup. The most used environment besides GNOME is KDE, and here is what cold startup looks like under KDE:

Average startup time (ms)
GNOME cold cache 3382.0 ± 0.51%
KDE cold cache 4031.9 ± 0.48%

It's significantly slower, yet not as slow as the entirely cold cache case. This is due to KDE not using (thus not pre-loading) some of the GNOME core libraries, yet using libraries in common, like e.g. libc (obviously), or dbus.

2011-01-03 16:59:17+0900

firefox, p.m.o | 4 Comments »

Efficient way to get files off the page cache

There's this great feature in modern operating systems called the page cache. Simply put, it keeps in memory what normally is stored on disk and helps both read and write performance. While it's all nice for a day to day use, it often gets in the way when one wants to track performance issues with "cold cache" (when the files you need to access are not in the page cache yet).

A commonly used command to flush the Linux page cache is the following:

# echo 3 > /proc/sys/vm/drop_caches

Unfortunately, its effect is broad, and it flushes the whole page cache. When working on cold startup performance of an application like Firefox, what you really want is to have your page cache in a state close to what it was before you started the application.

One way to get in a better position than flushing the entire page cache is to reboot: the page cache will be filled with system and desktop environment libraries during the boot process, making the application startup closer to what you want. But it takes time. A whole lot of it.

In one of my "what if" moments, I wondered what happens to the page cache when using posix_fadvise with the POSIX_FADV_DONTNEED hint. Guess what? It actually reliably flushes the page cache for the given range in the given file. At least it does so with Debian Squeeze's Linux kernel. Provided you have a list of files your application loads that aren't already in the page cache, you can flush these files and only these from the page cache.

The following source code compiles to a tool to which you give a list of files as arguments, and that flushes these files:

#include <unistd.h>
#include <fcntl.h>
#include <sys/stat.h>
int main(int argc, char *argv[]) {
  int i, fd;
  for (i = 1; i < argc; i++) {
    if ((fd = open(argv[i], O_RDONLY)) != -1) {
      struct stat st;
      fstat(fd, &st);
      posix_fadvise(fd, 0, st.st_size, POSIX_FADV_DONTNEED);
      close(fd);
    }
  }
  return 0;
}

It's actually a pretty scary feature, especially on multi-user environments, because any user can flush any file she can open, repeatedly, possibly hitting system performance. By the way, on systems using lxc (and maybe other containers, I don't know), running the echo 3 > /proc/sys/vm/drop_caches command from a root shell in a container does flush the host page cache, which could be dangerous for VPS hosting services using these solutions.

Update: I have to revise my judgment, it appears posix_fadvise(,,,POSIX_FADV_DONTNEED) doesn't flush (parts of) files that are still in use by other processes, which still makes it very useful for my usecase, but also makes it less dangerous than I thought. The drop_cache problem is still real with lxc, though.

2010-12-29 19:34:37+0900

miscellaneous, p.d.o, p.m.o | 11 Comments »