Knowing how much disk seeks hurt
We all know disk seeks hurt. But we usually don't have a precise idea how much. How about getting that idea?
Here is a little experiment I ran a few days ago. I took the output from the systemtap script tracking I/O I wrote, on a Firefox startup after boot. Each line of that output, which gives a timestamp (which we don't care about here), a file name, and an offset, represents a 4096 bytes read (one page).
The first set of data points I got is how much time it takes to reproduce this read pattern after a reboot, and how that compares to Firefox startup time. For what it's worth, I did group following reads, to avoid doing too many system calls, and also avoided kernel readahead by using direct I/O, meaning I would only read exactly what the kernel reads when Firefox normally starts.
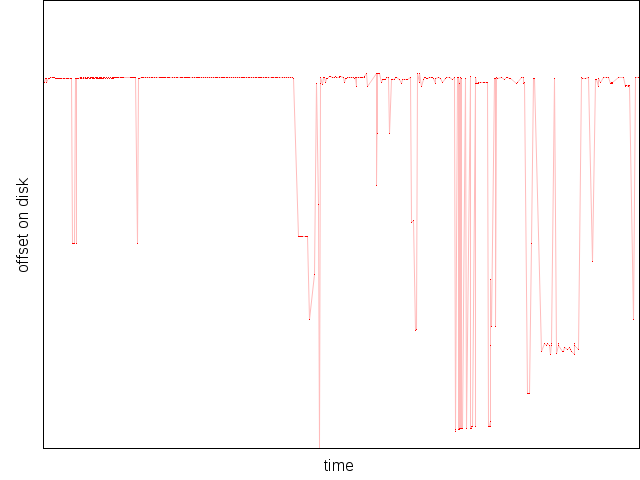
All the following tests were done under the usual conditions (see previous posts), but I limited the tests to the x86-64 architecture, because all that really matters is the disk. I'll mention, however, that the amount of data read in these tests is 34,729,984 bytes, and that the original I/O pattern looks like this:

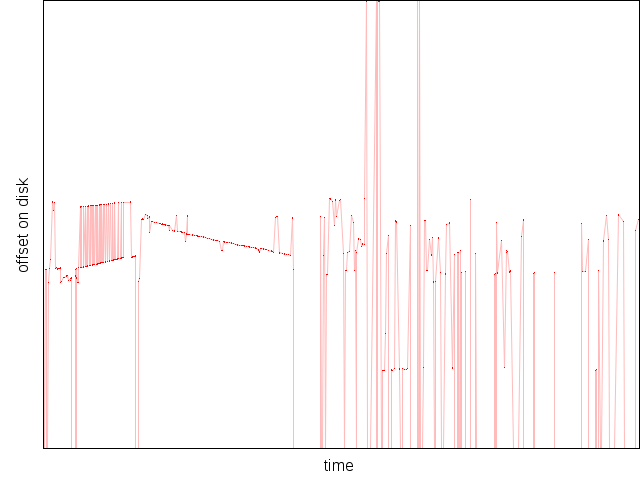
Zooming around the main location where most I/O happen, we can see the pattern is still bumpy:

This somehow looks familiar, doesn't it?
We already know for a fact that even these patterns that, on the whole disk, look like pretty much insignificant, have an important impact on startup time. Try to imagine what kind of difference could be observed if we were reordering all these reads.
Anyways, back to that I/O simulation, we first need to see how far it is from the actual Firefox startup. We would rather that simulated I/O + warm startup/hot cache end up close to the real thing. However, we need to keep in mind, as we saw in a previous post, that CPU scaling, when mixed with I/O, has an influence on startup time. Warm startup not involving I/O, the CPU can run at maximum speed the whole time. As such, for a fair comparison, we need to compare to cold startup time with the CPU forced at maximum speed, which we saw is faster than startup time with CPU scaling.
| Average time (ms) | |
|---|---|
| Simulated cold startup | 2,764.26 ± 0.42% |
| Warm startup | 250.74 ± 0.18% |
| Simulated cold + warm | 3015 |
| Real cold startup | 3087.47 ± 0.31% |
| Difference | 72.47 (2.35%) |
Close enough, I'd say. The difference is most probably caused by metadata reads and a few other things, that isn't in the systemtap script scope.
Now we know our simulated I/O is close to reality, what happens if we reorder all these reads according to the position on disk?
| Average time (ms) | Corresponding transfer rate | |
|---|---|---|
| Simulated I/O | 2,764.26 ± 0.42% | 12.56 MB/s |
| Reordered I/O | 1,473.34 ± 0.43% | 23.57 MB/s |
| Difference | 1,290.92 (46.7%) | n/a |
That's almost twice as fast ! And the disk doesn't even have a big throughput (around 30MB/s). Let's see what it does with a disk with a bigger throughput (85MB/s).
| Average time (ms) | Corresponding transfer rate | |
|---|---|---|
| Simulated I/O | 1,898.66 ± 0.16% | 18.29 MB/s |
| Reordered I/O | 644.0 ± 0.15% | 53.93 MB/s |
| Difference | 1,254.66 (66.08%) | n/a |
That's almost three times as fast ! The faster the disk, the bigger the improvement we can get by reordering and grouping I/O, which is not unexpected, but here we can see how much having to go back and forth on the disk hurt badly. Obviously, the numbers from the faster disk can't be directly compared to the ones from the slower disk, because the data was not arranged the same way on the disk, and file system fragmentation, as well as how the file system is filled also have their own share to add to the problem.
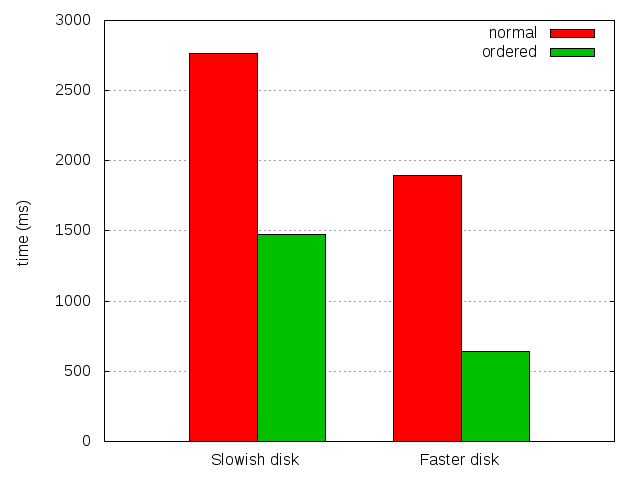
And because it's more impressive to see on a graph than in a result table:

Disks seeks hurt. Badly.
2011-02-08 15:42:43+0900
You can leave a response, or trackback from your own site.

2011-02-08 16:17:57+0900
Will this reordering work help on Windows too?
2011-02-08 16:36:06+0900
Harsh: this is only data analysis to open some improvement opportunities. This is mostly platform-agnostic.
2011-02-08 18:37:46+0900
I wonder how this sort of data looks on an SSD…
2011-02-08 18:53:19+0900
This is why my next upgrade will be an SSD :)
2011-02-08 19:00:39+0900
Boris: Firefox (any version, actually) with a dirty profile cold-starts under a second on my system with a slower CPU than the test system used for the blog post, but with an intel x25m SSD. Warm startup (CPU bound only) on that system is around 570ms.