Archive for January, 2014

Ccache efficiency on Mozilla builders

In the past two blog posts, I've detailed some results I got experimenting with a shared compilation cache. Today, I will be exploring in some more detail why ccache is not helping us as much as it should.

TL;DR conclusion: we need to be smarter about which build slaves build what.

Preliminary note: the stats below were gathered over a period of about 10 days after the holidays, on several hundred successful builds (failed builds were ignored ; this is skewed, but we don't have ccache stats for those).

Try builds

Try is a special repository. Developers push very different changes on it, based on more or less random points of mozilla-central history. But they'd also come back with different iterations of a patch set, and effectively rebuild mostly the same thing. One could expect cache hit rates to be rather low on those builds, and as we've seen in the past posts, they are.

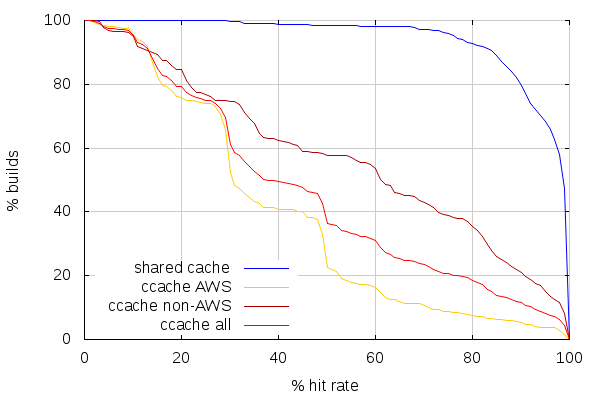
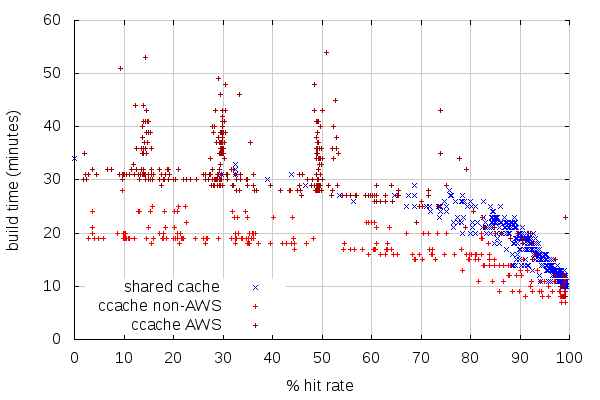
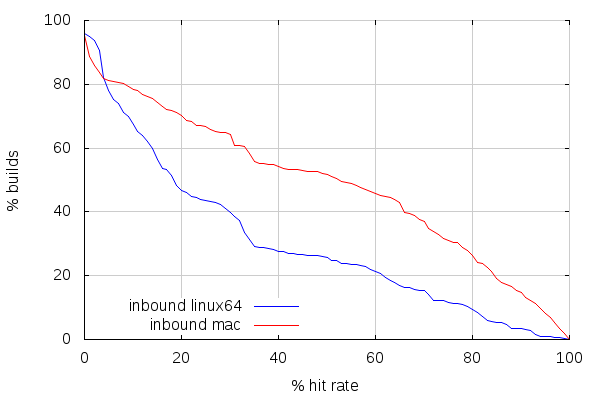
But while the previous posts were focusing on ccache vs. shared cache, let's see how it goes for different platforms using ccache, namely linux64 and mac, for one type of build each:

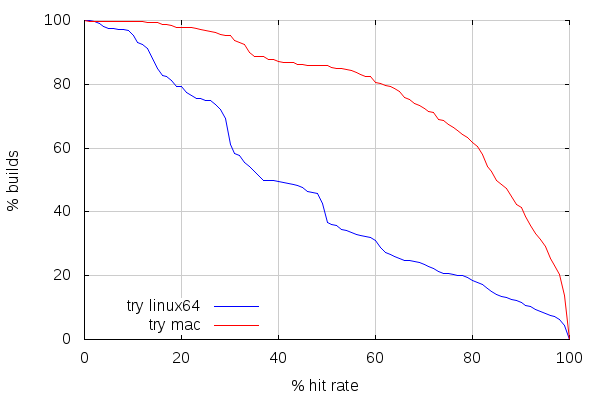
Here comes the surprise. Mac builds are getting a decent cache hit rate on try. Which is kind of surprising considering the usage pattern, but it's not what's the most interesting. Let's focus on why mac slaves have better hit rates than linux slaves.

And here's the main difference: there are way less mac slaves than there are linux slaves. The reason is that we do a lot of different build types on the linux slaves: linux 32 bits, 64 bits, android, ASAN, static rooting hazard analysis, valgrind, etc. We have 663 linux slaves and 23 mac slaves for try (arguably, a lot of the linux slaves are not running permanently, but you get the point), and they are all part of the same pool.

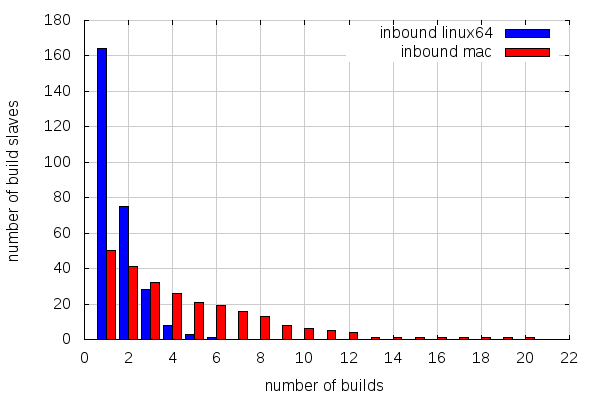
So let's look how those try builds I've been getting stats for were spread across slaves:

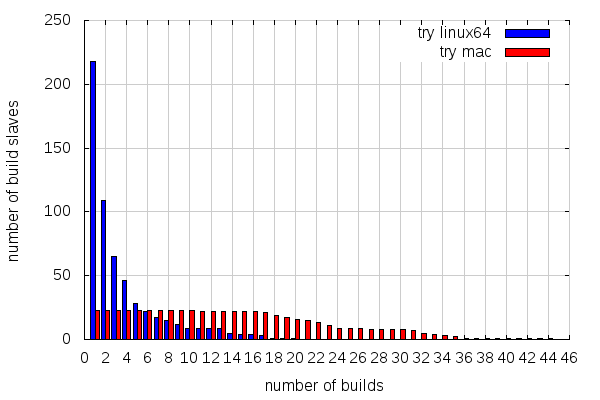
This is not the best graph in the world, but it shows how many slaves did x builds or more. So 218 linux slaves did one build or more, 109 did two builds or more, etc. And there comes the difference: half of the linux slaves have only done one linux64 opt build, while all the mac slaves involved have made at least 10 mac opt builds!

Overall, this is what it looks like:

  • 218 slaves for 587 builds on linux64 try (average: 2.7 builds per slave)
  • 23 slaves for 563 builds on mac try (average; 24.5 builds per slave)

Let's now compare linux builds cache hit rates for slaves with 5 builds and more, and 10 builds and more:

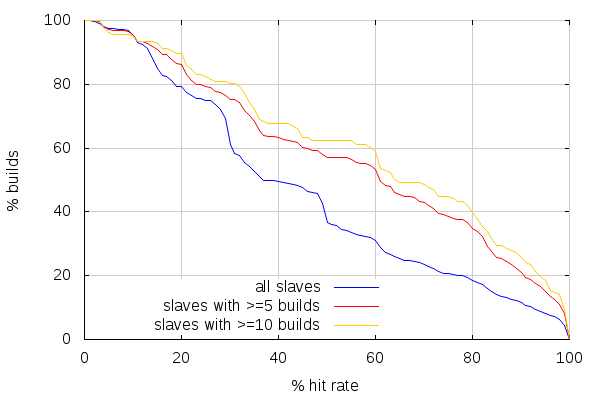
While the hit rates are better when looking at the slaves with more linux64 opt builds, they don't come close to mac hit rates. But this has to do with the fact that I merely removed results from slaves that only did a few builds. That didn't change how the builds were spread amongst slaves, and how more or less related those builds were in consequence: with fewer slaves to build on, slaves are more likely to build sources that look alike.

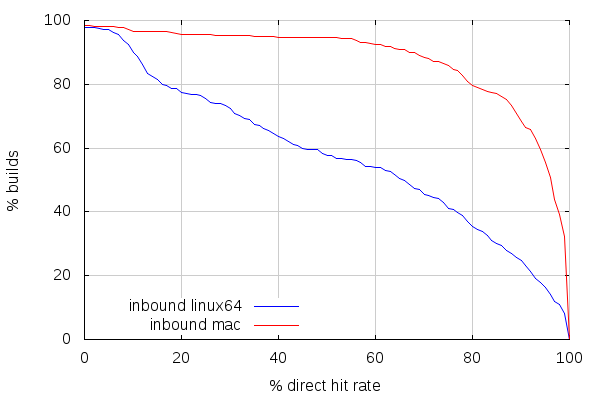
Interestingly, we can get a sense of how much builds done by a given slave are related by looking at direct mode cache hits.

The direct mode is a feature introduced in ccache 3 that avoids preprocessor calls by looking directly at sources files and their dependencies. When you have an empty cache, ccache will use the preprocessor as usual, but it will also store information about all the files that were used to preprocess the given source. That information, as well as the hash of the preprocessed source, is stored with a key corresponding, essentially, to a hash of the source file, unpreprocessed. So the next time the same source file is compiled, ccache will look at that dependency information (manifest), and check if all the dependent files are unchanged.

If they are, then it knows the hash of the preprocessed source without running the preprocessor, and can thus get the corresponding object file. If they aren't, then ccache runs the preprocessor, and does a lookup based on the preprocessed source. So the more direct mode cache hits there are compared to overall cache hits, the more slaves tended to build similar trees.

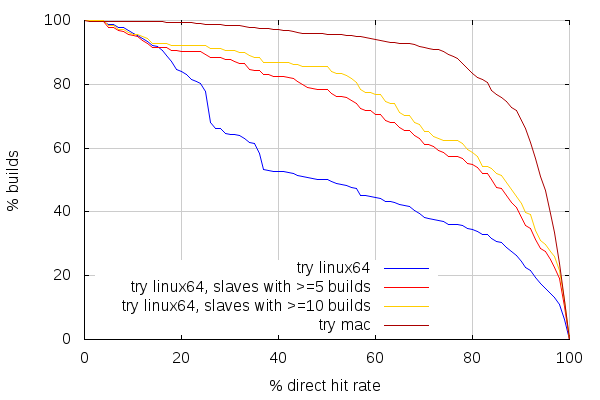
And again, looking at linux slaves with 5 or more builds, and 10 or more builds, shows the general trend that the more related builds a slave does, the more efficient the cache is (News at 11).

The problem is that we don't let them be efficient with the current pooling of slaves. Shared caching would conveniently wallpaper around that scheduling inefficiency. But the latency due to network access for the shared cache makes it necessary, for further build times improvements, to still have a local cache, which means we should still address that inefficiency.

Inbound builds

Inbound is, nowadays, the branch where most things happen. It is the most active landing branch, which makes it the place where most of future Firefox code lands first. Continuous integration of that branch relies on a different pool of build slaves than those used for try, but it uses the same pool of slaves as other project branches such as mozilla-central, b2g-inbound, fx-team, aurora, etc. or disposable branches. There are 573 linux slaves (like for try, not necessarily all running) and 63 mac slaves for all those branches.

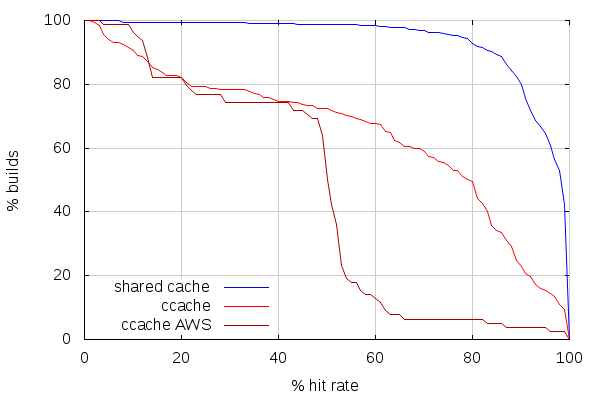
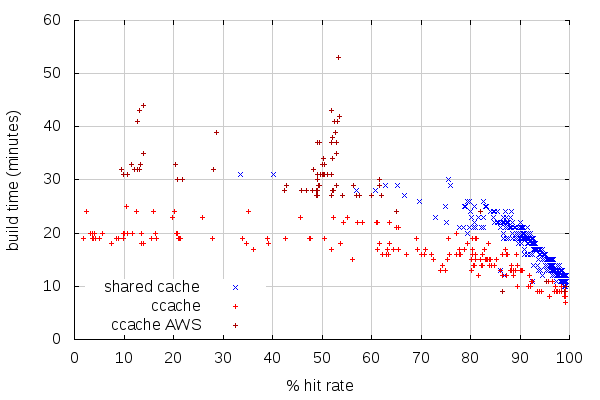
The first thing to realize here is that there are between 4 and 5% of those builds with absolutely no cache hit. I haven't researched why that is. Maybe we're starting with an empty cache on some slaves. Or maybe we recently landed something that invalidates the cache completely (build flags changes would tend to do that).

The second thing is that cache hit rate on inbound is lower than it is on try. Direct mode cache hit rates, below, show, however, a tendency for better similarity between builds than on try. Which is pretty much expected, considering inbound only takes incremental changes, compared to try, which takes random patch sets based on more or less randomly old mozilla-central changesets.

But here's the deal: builds are even more spread across slaves than on try.

There are also less builds than on try overall, but there are more slaves involved in proportion (repeating the numbers for try for better comparison):

  • 218 slaves for 587 builds on linux64 try (average: 2.7 builds per slave)
  • 164 slaves for 279 builds on linux64 inbound (average: 1.7 builds per slave)
  • 23 slaves for 563 builds on mac try (average; 24.5 builds per slave)
  • 50 slaves for 249 builds on mac inbound (average: 5 builds per slave)

Contrary to try, where all builds start from scratch (clobber builds), builds for inbound may start from a previous build state from an older changeset. We sometimes force clobber builds on inbound, but the expectation is that most builds should not be clobber builds. The fact that so few builds run on a same slave over a period of 10 days undermines that and likely makes us mostly do near clobber builds all the time. But this will be the subject of next post. Stay tuned.

Note: CCACHE_BASEDIR makes things a bit more complicated, since the same slaves are used for various branches and CCACHE_BASEDIR might help getting better hit rates across branches, but since inbound is the place where most things land first, it shouldn't influence too much the above analysis.

Although, there is a concern that the number of different unrelated branches and different build types occurring on a same slave might be helping cache entries being evicted because the cache has a finite size. There are around 200k files in ccache on slaves, and a clobber build will fill about 8k. It only takes about 25 completely unrelated builds (think different build flags, etc.) to throw an older build's cache away. I haven't analyzed this part of the problem, but it surely influences cache hit rate in the wrong direction.

Anyways, for all these reasons, and again, while shared cache will wallpaper over it, we need to address the build scheduling inefficiencies somehow.

2014-01-31 10:56:39+0900

p.m.o | 1 Comment »

Shared compilation cache experiment, part 2

I spent some more time this week on the shared compilation cache experiment, in order to get it in a shape we can actually put in production.

As I wrote in the comments to previous post, the original prototype worked similarly to ccache with CCACHE_NODIRECT and CCACHE_CPP2. Which means it didn't support ccache's direct mode, and didn't avoid a second preprocessor invocation on cache misses. While I left the former for (much) later improvements, I implemented the latter, thinking it would improve build times. And it did, but only marginally: 36 seconds on a ~31 minutes build with 100% cache misses (and no caching at all, more on that below). I was kind of hoping for more (on the other hand, with unified sources, we now have less preprocessing and more compilation...).

Other than preprocessing, one of the operations every invocation of the cache script for compilation does is to hash various data together (including the preprocessed source) to get a unique id for a given (preprocessed) source, compiler and command line combination. I originally used MD4, like ccache, as hash algorithm. While unlikely, I figured there would be even less risks of collisions with SHA1, so I tried that. And it didn't change the build times much: 6 seconds build time regression on a ~31 minutes build with 100% cache misses.

As emptying the cache on S3 is slow, I tested the above changes with a modified script that still checks the cache for existing results, but doesn't upload anything new to the cache. The interesting thing to note is that this got me faster build times: down to 31:15 from 34:46. So there is some overhead in pushing data to S3, even though the script uploads in the background (that is, the script compiles, then forks another process to do the actual upload, while the main script returns so that make can spawn new builds). Fortunately, cache hit rates are normally high, so it shouldn't be a big concern.

Another thing that was missing is compression, making S3 transfers and storage huge. While the necessary bandwidth went down with compression implemented, build times didn't move. The time spent on compression probably compensates for the saved bandwidth.

To summarize, following are the build times I got, on the same changeset, on the same host, with different setups, from fastest to slowest:

  • 99.9% cache hit, preprocessor run once, md4: 10:57
  • 99.9% cache hit, preprocessor run once, md4, no compression: 10:59
  • build without wrapping with cache script: 27:05
  • no actual caching, preprocessor run once, md4: 30:39 (average of 5 builds, low variance)
  • no actual caching, preprocessor run once, sha1: 30:45 (average of 5 builds, low variance)
  • no actual caching, preprocessor run twice, md4: 31:15 (average of 5 builds, low variance)
  • 100% cache miss with caching, preprocessor run twice, md4: 34:46
  • 100% cache miss with caching, preprocessor run twice, md4, no compression: 34:41

For reference, the following are build times on the same host with the same changeset, with ccache:

  • 99.9% cache hit: 5:59
  • 100% cache miss: 28:35

This means the shared cache script has more overhead than ccache has (also, that SSDs with ccache do wonders with high cache hit rates, but, disclaimer, both ccache builds were run one after the other, there may have not been much I/O on the 99.9% cache hit build). On the other hand, 99.9% hit rate is barely attained with ccache, and 100% cache miss rarely obtained with shared cache. Overall, I'd expect average build times to be better with shared cache, even with its current overhead, than they are with ccache.

Cache stats redux

The previous post had ccache stats which didn't look very good, and it could have been related to both the recent switch to AWS spot instances and the holiday break. So I re-ran builds with the shared cache on the same setup as before, replaying the 10 past days or so of try builds after the holiday break, and compared again with what happened on try.

The resulting stats account for 587 linux64 opt builds on try, 356 of which ran on AWS slaves, vs. 231 on non-AWS slaves (so, much more builds ran on AWS, in proportion, compared to last time).

(Note this time I added a line combining both AWS and non-AWS ccache stats)

The first observation to make is that the line for shared cache looks identical. Which is not surprising, but comforting. The next observation is that ccache hit rates got worse on non-AWS slaves, and got slightly better on AWS slaves above 50% hit rate, but worse below. This still places ccache hit rates very far from what can be achieved with a shared cache.

The comparison between build times and hit rates, on the other hand, looks very similar to last time on both ends.

One interesting phenomenon is the three spikes of spread build times. Considering the previous graphs, one of the reason for the spikes is because there are many builds with about the same hit rate (which in itself is interesting), but the strange thing is how different the build times can be at those rates. The origin of this might be the use of EBS which may not have the same performance on all AWS instances. The builders for shared cache, on the other hand, were using ephemeral SSD storage for the build.

While the graphs look similar, let's see how average build times evolved:

  • on custom builders with shared cache: 14:30, (slightly up from 14:20).
  • on try non-AWS build slaves: 16:49 (up from 15:27).
  • on try AWS build slaves: 32:21 (up from 31:35).

This matches the observation from the first graph: cache hits regressed on try build slaves, but stays the same on custom builders with shared cache. And with the now different usage between AWS and non-AWS, the overall build time average on try went up significantly: from 20:03 to 26:15. This might mean we should build more on non-AWS slaves, but we don't have the capacity (which is why we're using AWS in the first place). But it means AWS slave builds are currently slower than non-AWS, and that hurts. And that we need to address that.

(Note those figures only include build time, not any of the preparation steps (which can be long for different reasons), or any of the post-build steps (make package, make check, etc.))

One of the figures that wasn't present in the previous post, though, to put those averages in perspective, is standard deviation. And this is what it looks like:

  • on custom builders with shared cache: 5:12.
  • on try non-AWS build slaves: 4:41.
  • on try AWS build slaves: 8:26.

Again, the non-AWS build slaves are better here, but shared cache may help us for AWS build slaves. Test is currently undergoing to see how shared cache performs with those AWS slaves. Stay tuned.

2014-01-17 13:24:15+0900

p.m.o | 3 Comments »

Shared compilation cache experiment

One known way to make compilation faster is to use ccache. Mozilla release engineering builds use it. In many cases, though, it's not very helpful on developer local builds. As usual, your mileage may vary.

Anyways, one of the sad realizations on release engineering builds is that the ccache hit rate is awfully low for most Linux builds. Much lower than for Mac builds. According to data I gathered a couple months ago on mozilla-inbound, only about a quarter of the Linux builds have a ccache hit rate greater than 50% while more than half the Mac builds have such a hit rate.

A plausible hypothesis for most of this problem is that the number of build slaves being greater on Linux, a build is less likely to occur on a slave that has a recent build in cache. And while better, the Mac cache hit rates were not really great either. That's due to the fact that consecutive pushes, that share like > 99% code in common, are most usually not built on the same slave.

With this in mind, at Taras's request, I started experimenting, before the holiday break, with sharing the ccache contents. Since a lot of our builds are running on Amazon Web Services (AWS), it made sense to run the experiment with S3.

After setting up some AWS instances as custom builders (more on this in a subsequent post) with specs similar to what we use for build slaves, I took past try pushes and replayed them on my builder instances, with a proof of concept, crude implementation of ccache-like compilation caching on S3. Both the build times and cache hit rate looked very promising. Unfortunately, I didn't get the corresponding try build stats at the time, and it turns out the logs are now gone from the FTP server, so I had to rerun the experiment yesterday, against what was available, which is the try logs from the past two weeks.

So, I ran 629 new linux64 opt builds using between 30 and 60 builders. Which ended up being too much because the corresponding try pushes didn't all trigger linux64 opt builds. Only 311 of them did. I didn't start this run with a fresh compilation cache, but obviously, so do try builders, so it's fair game. Of my 629 builds, 50 failed. Most of those failures were due to problems in the corresponding try pushes. But a few were problems with S3 that I didn't handle in the PoC (sometimes downloading from S3 fails for some reason, and that would break the build instead of falling back to compiling locally), or with something fishy happening with the way I set things up.

Of the 311 builds on try, 23 failed. Of those 288 successful builds, 8 lack ccache stats, because in some cases (like a failure during "make check") the ccache stats are not printed. Interestingly, only 81 of the successful builds ran on AWS, while 207 ran on Mozilla-owned machines. This unfortunately makes build time comparisons harder.

With that being said, here is how cache hit rates compare between non-AWS build slaves using ccache, AWS build slaves using ccache and my AWS builders using shared cache:

The first thing to note here is that this quite doesn't match my observations from a few months ago on mozilla-inbound. But that could very be related to the fact that try and mozilla-inbound pushes have different patterns.

The second thing to note is how few builds have more than 50% hit rate on AWS build slaves. A possible explanation is that AWS instances are started with a prefilled but old ccache (because looking at the complete stats shows the ccache storage is almost full), and that a lot of those AWS slaves are new (we recently switched to using spot instances). It would be worth checking the stats again after a week of try builds.

While better, non-AWS slaves are still far from efficient. But the crude shared cache PoC shows very good hit rates. In fact, it turns out most if not all builds with less than 50% hit rate are PGO or non-unified builds. As most builds are neither, the cache hit rate for the first few of those is low.

This shows another advantage of the shared cache: a new slave doesn't have to do slow builds before doing faster builds. It gets the same cache hit rate as slaves that have been running for longer. Which, on AWS, means we could actually shutdown slaves during low activity periods, without worrying about losing the cache data on ephemeral storage.

With such good hit rates, we can expect good build times. Sadly, the low number of high ccache hit rate builds on AWS slaves makes the comparison hard. Again, coming back with new stats in a week or two should make for better numbers to compare against.

(Note that I removed, from this graph, non-unified and PGO builds, which have very different build times)

At first glance, it would seem builds with the shared cache are slower, but there are a number of factors to take into account:

  • The non-AWS build slaves are generally faster than the AWS slaves, which is why the builds with higher hit rates are generally faster with ccache.
  • The AWS build slaves have pathetic build times.
  • As the previous graph showed, the hit rates are very good with the shared cache, which places most of those builds on the right end of this graph.

This is reflected on average build times: with shared cache, it is 14:20, while it is 15:27 with ccache on non-AWS slaves. And the average build time for AWS slaves with ccache is... 31:35. Overall, the average build time on try, with AWS and non-AWS build slaves, is 20:03. So on average, shared cache is a win over any setup we're currently using.

Now, I need to mention that when I say the shared cache implementation I used is crude, I do mean it. For instance, it doesn't re-emit warnings like ccache does. But more importantly, it's not compressing anything, which makes its bandwidth use very high, likely making things slower than they could be.

I'll follow-up with hopefully better stats in the coming weeks. I may gather stats for inbound, as well. I'll also likely test the same approach with Windows builds some time soon.

2014-01-08 00:36:22+0900

p.m.o | 5 Comments »