Shared compilation cache experiment
One known way to make compilation faster is to use ccache. Mozilla release engineering builds use it. In many cases, though, it's not very helpful on developer local builds. As usual, your mileage may vary.
Anyways, one of the sad realizations on release engineering builds is that the ccache hit rate is awfully low for most Linux builds. Much lower than for Mac builds. According to data I gathered a couple months ago on mozilla-inbound, only about a quarter of the Linux builds have a ccache hit rate greater than 50% while more than half the Mac builds have such a hit rate.
A plausible hypothesis for most of this problem is that the number of build slaves being greater on Linux, a build is less likely to occur on a slave that has a recent build in cache. And while better, the Mac cache hit rates were not really great either. That's due to the fact that consecutive pushes, that share like > 99% code in common, are most usually not built on the same slave.
With this in mind, at Taras's request, I started experimenting, before the holiday break, with sharing the ccache contents. Since a lot of our builds are running on Amazon Web Services (AWS), it made sense to run the experiment with S3.
After setting up some AWS instances as custom builders (more on this in a subsequent post) with specs similar to what we use for build slaves, I took past try pushes and replayed them on my builder instances, with a proof of concept, crude implementation of ccache-like compilation caching on S3. Both the build times and cache hit rate looked very promising. Unfortunately, I didn't get the corresponding try build stats at the time, and it turns out the logs are now gone from the FTP server, so I had to rerun the experiment yesterday, against what was available, which is the try logs from the past two weeks.
So, I ran 629 new linux64 opt builds using between 30 and 60 builders. Which ended up being too much because the corresponding try pushes didn't all trigger linux64 opt builds. Only 311 of them did. I didn't start this run with a fresh compilation cache, but obviously, so do try builders, so it's fair game. Of my 629 builds, 50 failed. Most of those failures were due to problems in the corresponding try pushes. But a few were problems with S3 that I didn't handle in the PoC (sometimes downloading from S3 fails for some reason, and that would break the build instead of falling back to compiling locally), or with something fishy happening with the way I set things up.
Of the 311 builds on try, 23 failed. Of those 288 successful builds, 8 lack ccache stats, because in some cases (like a failure during "make check") the ccache stats are not printed. Interestingly, only 81 of the successful builds ran on AWS, while 207 ran on Mozilla-owned machines. This unfortunately makes build time comparisons harder.
With that being said, here is how cache hit rates compare between non-AWS build slaves using ccache, AWS build slaves using ccache and my AWS builders using shared cache:
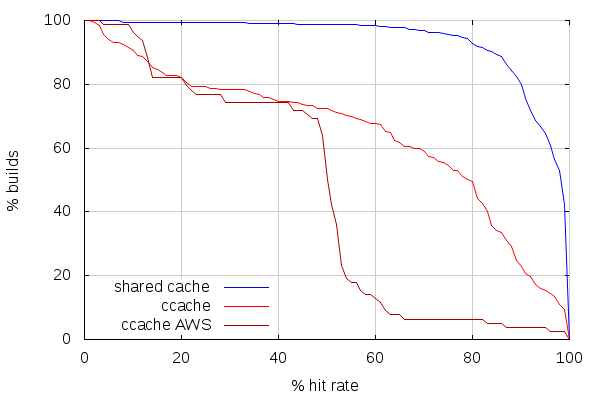
The first thing to note here is that this quite doesn't match my observations from a few months ago on mozilla-inbound. But that could very be related to the fact that try and mozilla-inbound pushes have different patterns.
The second thing to note is how few builds have more than 50% hit rate on AWS build slaves. A possible explanation is that AWS instances are started with a prefilled but old ccache (because looking at the complete stats shows the ccache storage is almost full), and that a lot of those AWS slaves are new (we recently switched to using spot instances). It would be worth checking the stats again after a week of try builds.
While better, non-AWS slaves are still far from efficient. But the crude shared cache PoC shows very good hit rates. In fact, it turns out most if not all builds with less than 50% hit rate are PGO or non-unified builds. As most builds are neither, the cache hit rate for the first few of those is low.
This shows another advantage of the shared cache: a new slave doesn't have to do slow builds before doing faster builds. It gets the same cache hit rate as slaves that have been running for longer. Which, on AWS, means we could actually shutdown slaves during low activity periods, without worrying about losing the cache data on ephemeral storage.
With such good hit rates, we can expect good build times. Sadly, the low number of high ccache hit rate builds on AWS slaves makes the comparison hard. Again, coming back with new stats in a week or two should make for better numbers to compare against.
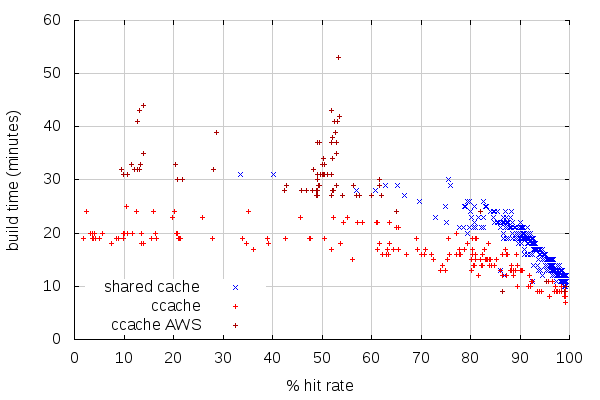
(Note that I removed, from this graph, non-unified and PGO builds, which have very different build times)
At first glance, it would seem builds with the shared cache are slower, but there are a number of factors to take into account:
- The non-AWS build slaves are generally faster than the AWS slaves, which is why the builds with higher hit rates are generally faster with ccache.
- The AWS build slaves have pathetic build times.
- As the previous graph showed, the hit rates are very good with the shared cache, which places most of those builds on the right end of this graph.
This is reflected on average build times: with shared cache, it is 14:20, while it is 15:27 with ccache on non-AWS slaves. And the average build time for AWS slaves with ccache is... 31:35. Overall, the average build time on try, with AWS and non-AWS build slaves, is 20:03. So on average, shared cache is a win over any setup we're currently using.
Now, I need to mention that when I say the shared cache implementation I used is crude, I do mean it. For instance, it doesn't re-emit warnings like ccache does. But more importantly, it's not compressing anything, which makes its bandwidth use very high, likely making things slower than they could be.
I'll follow-up with hopefully better stats in the coming weeks. I may gather stats for inbound, as well. I'll also likely test the same approach with Windows builds some time soon.
2014-01-08 00:36:22+0900
Responses are currently closed, but you can trackback from your own site.

2014-01-08 09:24:23+0900
I don’t entirely understand your experiment, or I’d probably be able to answer these questions myself. With a shared cache, you’re trading a local compile for an S3 read + a data transfer. How fast are the cache hits? How many local compiles are faster than cache hits?
In the shared cache case, are you also using ccache on the local build machine? That should end up with a 2-level cache. But for all I know, local disk access could be slower than S3 access.
Does “shared cache” imply “AWS slave”, or did you have some way of accessing the shared cache from the non-AWS slaves too? I’m still unsure of the experimental setup.
This stuff is great. It reminds me of https://blog.mozilla.org/sfink/2011/10/07/distcc-ccache-and-bacon/ and https://wiki.mozilla.org/Sfink/Thought_Experiment_-_One_Minute_Builds but you’re actually doing something about it. I’m very happy to see it!
2014-01-08 10:57:47+0900
I can’t say how fast are cache hits exactly, but i can say that a local compile on the same AWS instance without ccache takes about 27 minutes, while a build with 99.9% cache hit takes 11 minutes.
In the shared cache case, there is no additional ccache on the local machine, although that’s something that /could/ be added if that happens to make things even faster.
The shared cache experiment was run on custom AWS builders. None of the slaves used by releng have access to S3 at the moment, so no such testing could be performed.
2014-01-08 17:33:42+0900
I was just thinking of the limiting case where you have 100% remote cache hit rate. Then you have 0 time spent compiling, and all of your time is requesting and receiving data, plus linking (and preprocessing? How does your remote cache work?) In that situation, I expect the bottleneck to be transfer times, and some of those (synchronous) requests are going to take longer than a local compile. It’d be nice to have per-file timings to see how many of those there are, and whether it’s contributing anything significant to the total time.
Then again, perhaps with a local ccache these wouldn’t matter. Or they would be even worse, if local disk happens to be slower than a networked cache read…?
I also wonder if a well-cached build is hitting its parallelism limit, making the synchronous requests hurt. Our build system is pretty good at exposing the build parallelism, but it seems like the optimal number of local compile/link processes is probably different from the optimal number of cache fetch processes.
2014-01-08 23:40:23+0900
The shared cache implementation I used is like ccache with CCACHE_NODIRECT and CCACHE_CPP2, so it’s always invoking the preprocessor (and if it needs compiling, it will invoke it twice). And the test I conducted uses gcc, like we do on build slaves, which is slowish (at least, slower than clang). Note that even with ccache, far from all the cache hits are using direct mode.
So there’s always a lot of computation going on during compilation. Also, the build system has a big overhead currently, between configure, make export and make libs.
There are many things that can be done for the whole system to be faster than what the experiment showed, but the experiment is already conclusive with a dumb implementation. We can already start there, it’s better than what we have now. Especially adding windows support is likely to be a game changer, since we currently don’t have a cache at all on windows. Even not using S3 on windows would already be better than the current situation.
2017-03-28 19:54:43+0900
Why did you chose S3 as the cache storage location? Wouldn’t a EBS volume have been a better storage location or even an EFS? Did something prevent you from doing this?
I am looking to do the same and would appreciate your thoughts on this choice.