Shared compilation cache experiment, part 2
I spent some more time this week on the shared compilation cache experiment, in order to get it in a shape we can actually put in production.
As I wrote in the comments to previous post, the original prototype worked similarly to ccache with CCACHE_NODIRECT and CCACHE_CPP2. Which means it didn't support ccache's direct mode, and didn't avoid a second preprocessor invocation on cache misses. While I left the former for (much) later improvements, I implemented the latter, thinking it would improve build times. And it did, but only marginally: 36 seconds on a ~31 minutes build with 100% cache misses (and no caching at all, more on that below). I was kind of hoping for more (on the other hand, with unified sources, we now have less preprocessing and more compilation...).
Other than preprocessing, one of the operations every invocation of the cache script for compilation does is to hash various data together (including the preprocessed source) to get a unique id for a given (preprocessed) source, compiler and command line combination. I originally used MD4, like ccache, as hash algorithm. While unlikely, I figured there would be even less risks of collisions with SHA1, so I tried that. And it didn't change the build times much: 6 seconds build time regression on a ~31 minutes build with 100% cache misses.
As emptying the cache on S3 is slow, I tested the above changes with a modified script that still checks the cache for existing results, but doesn't upload anything new to the cache. The interesting thing to note is that this got me faster build times: down to 31:15 from 34:46. So there is some overhead in pushing data to S3, even though the script uploads in the background (that is, the script compiles, then forks another process to do the actual upload, while the main script returns so that make can spawn new builds). Fortunately, cache hit rates are normally high, so it shouldn't be a big concern.
Another thing that was missing is compression, making S3 transfers and storage huge. While the necessary bandwidth went down with compression implemented, build times didn't move. The time spent on compression probably compensates for the saved bandwidth.
To summarize, following are the build times I got, on the same changeset, on the same host, with different setups, from fastest to slowest:
- 99.9% cache hit, preprocessor run once, md4: 10:57
- 99.9% cache hit, preprocessor run once, md4, no compression: 10:59
- build without wrapping with cache script: 27:05
- no actual caching, preprocessor run once, md4: 30:39 (average of 5 builds, low variance)
- no actual caching, preprocessor run once, sha1: 30:45 (average of 5 builds, low variance)
- no actual caching, preprocessor run twice, md4: 31:15 (average of 5 builds, low variance)
- 100% cache miss with caching, preprocessor run twice, md4: 34:46
- 100% cache miss with caching, preprocessor run twice, md4, no compression: 34:41
For reference, the following are build times on the same host with the same changeset, with ccache:
- 99.9% cache hit: 5:59
- 100% cache miss: 28:35
This means the shared cache script has more overhead than ccache has (also, that SSDs with ccache do wonders with high cache hit rates, but, disclaimer, both ccache builds were run one after the other, there may have not been much I/O on the 99.9% cache hit build). On the other hand, 99.9% hit rate is barely attained with ccache, and 100% cache miss rarely obtained with shared cache. Overall, I'd expect average build times to be better with shared cache, even with its current overhead, than they are with ccache.
Cache stats redux
The previous post had ccache stats which didn't look very good, and it could have been related to both the recent switch to AWS spot instances and the holiday break. So I re-ran builds with the shared cache on the same setup as before, replaying the 10 past days or so of try builds after the holiday break, and compared again with what happened on try.
The resulting stats account for 587 linux64 opt builds on try, 356 of which ran on AWS slaves, vs. 231 on non-AWS slaves (so, much more builds ran on AWS, in proportion, compared to last time).
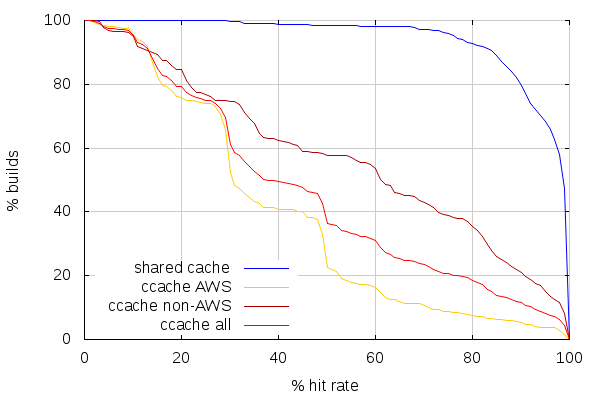
(Note this time I added a line combining both AWS and non-AWS ccache stats)
The first observation to make is that the line for shared cache looks identical. Which is not surprising, but comforting. The next observation is that ccache hit rates got worse on non-AWS slaves, and got slightly better on AWS slaves above 50% hit rate, but worse below. This still places ccache hit rates very far from what can be achieved with a shared cache.
The comparison between build times and hit rates, on the other hand, looks very similar to last time on both ends.
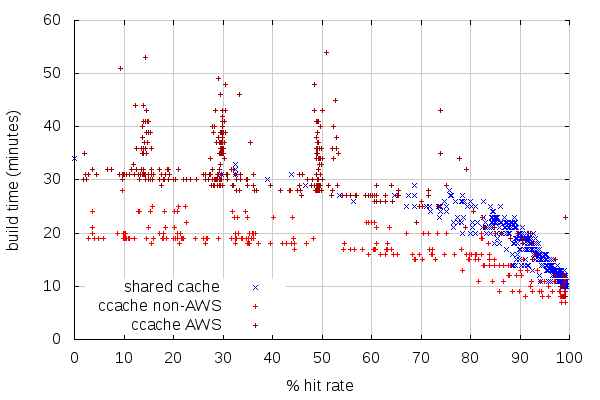
One interesting phenomenon is the three spikes of spread build times. Considering the previous graphs, one of the reason for the spikes is because there are many builds with about the same hit rate (which in itself is interesting), but the strange thing is how different the build times can be at those rates. The origin of this might be the use of EBS which may not have the same performance on all AWS instances. The builders for shared cache, on the other hand, were using ephemeral SSD storage for the build.
While the graphs look similar, let's see how average build times evolved:
- on custom builders with shared cache: 14:30, (slightly up from 14:20).
- on try non-AWS build slaves: 16:49 (up from 15:27).
- on try AWS build slaves: 32:21 (up from 31:35).
This matches the observation from the first graph: cache hits regressed on try build slaves, but stays the same on custom builders with shared cache. And with the now different usage between AWS and non-AWS, the overall build time average on try went up significantly: from 20:03 to 26:15. This might mean we should build more on non-AWS slaves, but we don't have the capacity (which is why we're using AWS in the first place). But it means AWS slave builds are currently slower than non-AWS, and that hurts. And that we need to address that.
(Note those figures only include build time, not any of the preparation steps (which can be long for different reasons), or any of the post-build steps (make package, make check, etc.))
One of the figures that wasn't present in the previous post, though, to put those averages in perspective, is standard deviation. And this is what it looks like:
- on custom builders with shared cache: 5:12.
- on try non-AWS build slaves: 4:41.
- on try AWS build slaves: 8:26.
Again, the non-AWS build slaves are better here, but shared cache may help us for AWS build slaves. Test is currently undergoing to see how shared cache performs with those AWS slaves. Stay tuned.
2014-01-17 13:24:15+0900
Responses are currently closed, but you can trackback from your own site.

2014-01-18 15:31:11+0900
You could try using a faster compression algorithm to improve the S3 transfer overhead.
Using LZ4[1], the compression should be pretty much IO-bound, while still reducing the required bandwidth substantially.
[1]: http://fastcompression.blogspot.de/p/lz4.html
2014-01-23 06:12:26+0900
What’s going on in that last graph? It looks like ccache has hardly any effect on build time until you reach about a 70% hit rate. Why is that? I mean, if you pretend cache hit compiles take zero time and you ignore linking, then a 50% hit rate should mean your build takes half as much time, right? Well, either that, or there’s a serialized chain of compilations that entirely determines the compile time. (Which I suppose would be the case if cache hits were uniformly distributed across all files, you serialize on directories, and most directories have several files so that you basically never see a directory with a 100% hit rate. But the 1st two of those are not true.)
It’s not just an artifact of ccache, either. The shared cache has few data points < 70% hit rate, but the ones that are there show the same pattern.
2014-01-23 23:54:56+0900
The thing is, a) cache hit compiles don’t take zero time, b) cache miss compile times are not all equal. Especially now we have unified sources. Also, compilation (sadly) doesn’t take 100% of the build time.
Unrelatedly, the spikes of builds with the same amount of cache hits might be related to changes to some of the central headers, which essentially invalidate the cache for most of the tree.