Author Archive

Huge rotational disk(s) + dpkg = disaster

Since a few versions now, dpkg has been made "safer" in that it makes sure everything is written to disk after unpacking a package. It does so with sync(), which means all kernel buffer caches are being flushed. Between every package install. All kernel buffer caches. Imagine what it does when you have two 2TB hard drives (though they are far from being full). Update: The use of btrfs might not be helping either.

I have 2 concurrent pbuilder instances that have been installing iceweasel build dependencies for more than 40 minutes, and still not finished yet. I don't expect the builds themselves, including test suites, to take more than 20 minutes on that machine...

I should really start using eatmydata...

Update: with eatmydata, the package installation is almost instantaneous...

Update 2: It might just be btrfs. And the best part yet is that since sync() is global, even when running pbuilder over, say, tmpfs, it doesn't change a damn thing.

2010-10-20 01:48:25+0900

p.d.o | 9 Comments »

libxul.so startup coverage

During the work leading to my previous post, I used a modified version of icegrind and a modified version of Taras' systemtap script to gather data about vfs_read/vfs_write and file mapping induced I/O. The latter was useful to create the graphs in that previous post.

Using both simultaneously, I could get some interesting figures, as well as some surprises.

The above graph represents kernel readaheads on libxul.so, vs. the actual accesses to that file. Each pixel on the image (click to zoom in) represents a single byte in libxul.so. Each vertical line thus represents a page worth of data (4096 bytes). Pixel luminosity gives information about how the given byte in libxul.so was reached:

  • White: never accessed
  • Light colour: kernel readahead as seen by a systemtap __do_page_cache_readahead probe
  • Dark colour: actual read or write as spotted by icegrind

The most important ELF sections are highlighted with the same colour scheme as in the previous graphs.

The interesting part here is the following figures:

  • Excluding .eh_frame, 22,248,432 bytes are readahead by the kernel, out of which 9,764,529 bytes are actually accessed (44%)
  • 5,437,560 bytes are readahead from the .rela.dyn section, out of 5,437,560 (100%), while 4,640,040 are actually accessed (85%)
  • 12,134,040 bytes are readahead from the .text section, out of 14,419,608 (84%), while 2,771,736 are actually accessed (19%)
  • 1,574,224 bytes are readahead from the .rodata section, out of 2,037,072 (77%), while 217,338 are actually accessed (11%)
  • 2,001,872 bytes are readahead from the .data.rel.ro section, out of 2,001,872 (100%), while 1,689,318 are actually accessed (84%)
  • 469,984 bytes are readahead from the .data section, out of 469,984 (100%), while 256,319 are actually accessed (55%)

The actual use numbers would be better at function and data structures level instead of instruction and data byte level, but they already give a good insight: there is a lot to gain from both function and data reordering. Also, it appears relocation sections account for more than 25% of all the libxul.so reads on x86-64. This proportion is most certainly not as important on x86 because each relocation is at most half the size of an x86-64 relocation.

Knowing the above is obviously nothing new, but like with the previous data, its usefulness comes from gathering new data after various experiments and comparing.

Unfortunately, as can be seen when zooming in, these figures aren't entirely accurate: there are many actual accesses in places where the systemtap script didn't catch kernel readaheads. This means the kernel does read more than what is accounted above, thus making the actual use percentage appear higher than it is (but probably only slightly). I don't know why some accesses in mmap()ed memory either don't trigger a __do_page_cache_readahead or trigger an actual readahead longer than what requested to __do_page_cache_readahead. Understanding this is important to have a better grasp at what the kernel really does during the library initialization. This is why I hadn't included the read length in the previous graphs.

Gathering similar data for OSX and Windows would be pretty interesting.

Update: I found the unaccounted page readaheads, but there are still a few pages that are not being read this way. I found a better probe point for both accounting, so I will come back with updated figures in an upcoming post.

2010-10-04 19:38:22+0900

p.m.o | No Comments »

Getting figures on startup libxul I/O, and static initializers

As we saw in my previous analysis, there are several parts of the library initialization process that have a direct impact on startup performance, especially on big applications like Firefox. Understanding the various issues involved surely is important, and visualizing them and their evolution (through logs or graphs, the latter being more appealing to the eye) may be helpful.

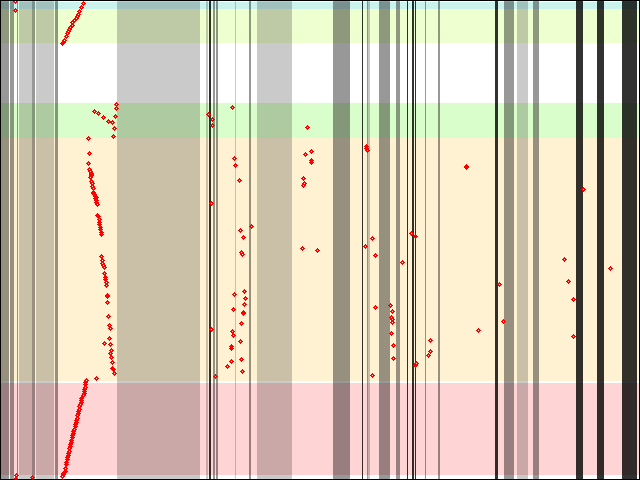
The above graph represents a whole lot of information about how libxul.so is accessed during startup.
[Disclaimer: there are problems with the data collection that don't help for the best accuracy. I'll talk about them in a subsequent post.]

  • The horizontal axis represents time, though as the data was gathered while the system and applications are loaded off a fast SSD drive, it does not show how some I/O can have a big impact on the startup time. The timeline also stops at the first access to an html test file given on the command line, which actually (and unfortunately) doesn't account for the whole startup.
  • The vertical axis is the offset within libxul.so where I/O occur, start of the file being at the bottom.
  • The red dots/bubbles represent each I/O. Access length is actually not represented for reasons I'll give in the subsequent post.
  • The horizontal coloured bars represent various important sections of the libxul.so file. From bottom to top, .rela.dyn, .text, .rodata, .data.rel.ro, and .data. Note the huge gap between .rodata and .data.rel.ro is .eh_frame (the data was gathered on x86-64, but x86 patterns are close enough that I didn't bother)
  • The vertical grayed areas represent time where I/O occur to other files than libxul.so. The lightest shade represents I/O on system files, the slightly darker one I/O on files in the Firefox directory, and the darkest one (almost black) I/O on profile files. Each of these areas starts on the beginning of the first access to a file in a given category and ends on the end of last access to a file within the same category. They obviously don't relate to where code is being executed, but somehow to where a rotating hard disk head might be (though fragmentation makes that more or less irrelevant). The data was gathered after a total flush of the page cache, which is biased because on a typical desktop, the page cache will already be populated with most system libraries Firefox requires.

The leftmost part of the graph is really nothing new or surprising if you read Taras' blog and my previous post: Initialization of other (system) libraries, followed by relocations, then static initializers.

One of the things this graph shows that was only a hunch before is that the relocation process ends up reading the whole .data.rel.ro and .data sections as a byproduct. Or at least, it reads enough of them that it's not read again later (even on longer sessions, accesses to .data.rel.ro and .data don't show up).

It also appears that .rodata is accessed in an unordered manner from the static initializers, but not enough to cover the whole section. Also, as Taras explained, static initializers are run backwards, starting with the last one. Some of them also call some functions within libxul.so, which explains why the static initialization phase accesses in .text are not entirely sequentially backwards.

Follows accesses to a bunch of different files, and calls to functions spread accross the .text section.

There are several places that can help improving startup time (some are Linux only, but others echo on Windows and Mac ; please note none of the following is really new):

  • Get rid of static initializers. More on this below.
  • Avoid going back and forth during relocation process. We're going to test how much good madvise() will do.
  • Improve the relocation process. We are planning to experiment relocation sections packing/compression. The ongoing deCOMtamination process may help reducing the amount of relocations, too, by removing the need for some vtables (around 75% of the relocations are for vtables entries).
  • Improve code layout. Taras initialized this with icegrind, aiming at reordering functions, which requires help from the linker. Before that, I'd like to try reordering object files and see how it helps. This should be made easier by Kyle's fakelibs.
  • Reduce I/O to other files. A great part of that is being addressed with omnijar and jar reordering, and more attempts at reducing I/O from e.g. profile files are in progress.

I'm currently working on reducing the number of static initializers, and wanted to have a more accurate view on how this reduction affects startup. Unfortunately, mozilla-central is a moving target, and some patches I was working on already don't apply anymore, so I only gathered data after the first (big) batch of static initializer removal: cycle collection induced ones (60% of all the static initializers).

There are obvious upside and downside to static initializers removal: the upside is that backwards I/O tending to be suboptimal, reducing the amount of backwards seek should help. The downside is that anything that is not read during the static initialization phase and thus put in page cache may be required at a later time. For example, if a function is a few bytes or kilobytes after a static initializer and is used during startup, its code will be cached when reading the static initializer because of readahead. If the static initializer is removed, this function will still be accessed, thus itself triggering an I/O, but later in the startup process. The main question is whether the upside overtakes the downside.

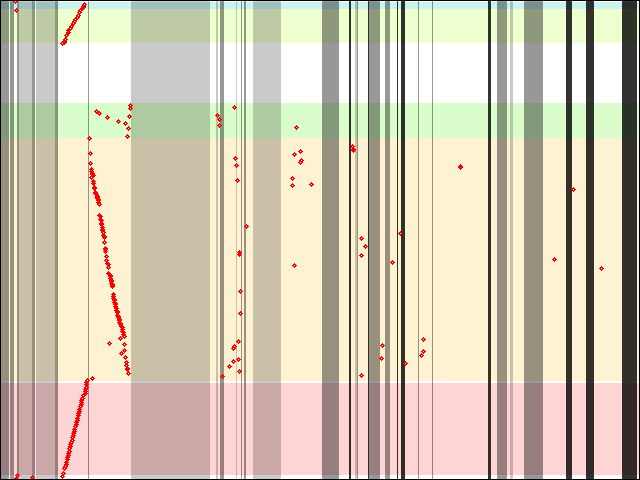
The above graph represents the same kind of data as the first graph (be aware the timescale is most probably different, and irrelevant anyways), with 179 static initializers less, out of 296 (when I started, there were "only" 237 static initializers, *sigh* ; sure cycle collection induced ones grew, but there's also 27 more that are not cycle collection). If you take a closer look and compare both graphs, you'll see that apart from the obvious static initializers reduction, there are, as expected, much more I/O later. I won't ask you to count how many more, fortunately, computers and scripts are our friends here.

Initially, there were 176 accessed in the leftmost part, and 56 subsequent accesses. After the static initializer reduction, the leftmost part got reduced to 136, and the subsequent part went up to 85. Overall, I now get 221 accesses instead of 232, which may or may not be an actual (direct) win, depending on disk fragmentation, and depending how spread the accesses are.

One figure that may help getting an idea how spread they are is to add all the different seeks happening within libxul.so alone. Doing so gives the following results:

  • Initially: 815,951,659 forward ; 620,941,312 backwards ; 1,436,892,971 overall
  • After static initializers reduction: 828,703,162 forward ; 617,279,488 backwards ; 1,445,982,650 overall

Overall, the after static initializers reduction result might be worse than before. Not even counting on the fact that backwards seeks are supposedly worse than forward seeks (I seem to remember reading something like this a while ago, factual information would be appreciated).

All in all, I'm afraid the static initializers reduction will only have a visible impact when combined with functions or objects reordering, and static initializers grouping.

I will follow up when I get the number further of static initializers down, in other words, once I rebased my work on the revision I was testing. I'd also like to make the graphs less static.

2010-09-30 16:30:28+0900

p.m.o | 3 Comments »

Don’t trust btrfs-show

I recently started using btrfs, in both raid0 and raid1 setups, and migrated some data there.

Once all the data was copied, I wanted to check how much overhead moving to btrfs meant, space-wise.

# df -h /mnt/share
Filesystem Size Used Avail Use% Mounted on
/dev/sdb3 932G 682G 250G 74% /mnt/share

# btrfs-show /dev/sdb3
Label: none uuid: e06484de-fb18-4564-b6e6-adbaed8bebec
Total devices 2 FS bytes used 681.61GB
devid 2 size 465.66GB used 427.13GB path /dev/sdb3
devid 1 size 465.66GB used 427.15GB path /dev/sda3

The filesystem was freshly created, in a raid0 fashion, so both 465GB partitions are used to form (roughly) a 930GB volume.
So, I had filled it with 682GB of data, and df was telling me 250GB were left, which is not unexpected. What I didn't expect, though, is btrfs-show telling me 427GB were used on each partition. Again, the filesystem was freshly created and the data had just been copied over, so I wasn't expecting these numbers to be off.

Which meant 854GB were being allocated on disk for 681GB of data, 25% overhead !

Curious to know how much left that really meant, I just tried a stupid thing: filling as much as btrfs permits:

# dd if=/dev/zero of=/mnt/share/zero bs=1M
dd: writing `/mnt/share/zero': No space left on device
253359+0 records in
253358+0 records out
265665118208 bytes (266 GB) copied, 1144.41 s, 232 MB/s
# du -sh /mnt/share/zero
248G /mnt/share/zero

It turns out I actually could write for the amount of free space df was claiming was free (modulo GiB-GB conversions).

# df -h /mnt/share
Filesystem Size Used Avail Use% Mounted on
/dev/sdb3 932G 930G 2.0G 100% /mnt/share

# btrfs-show /dev/sdb3
Label: none uuid: e06484de-fb18-4564-b6e6-adbaed8bebec
Total devices 2 FS bytes used 929.36GB
devid 2 size 465.66GB used 465.13GB path /dev/sdb3
devid 1 size 465.66GB used 465.15GB path /dev/sda3

So, this time df is slightly off, and btrfs-show somehow agrees the filesystem is full.

But surprises don't stop there:

# rm /mnt/share/zero

# df -h /mnt/share
Filesystem Size Used Avail Use% Mounted on
/dev/sdb3 932G 682G 250G 74% /mnt/share

# btrfs-show /dev/sda3
Label: none uuid: e06484de-fb18-4564-b6e6-adbaed8bebec
Total devices 2 FS bytes used 929.36GB
devid 2 size 465.66GB used 465.13GB path /dev/sdb3
devid 1 size 465.66GB used 465.15GB path /dev/sda3

That's right, even after the file removal, for btrfs-show, everything is still in use. Even after several sync or several hours later.

All in all, just don't trust what btrfs-show says.

NB: one also needs to know that df reports wrong sizes for raid1 setups, but that's another story.

2010-09-25 17:53:53+0900

p.d.o | 1 Comment »

eSATA FTW

I've had external disks supporting all of firewire, usb and eSATA for a while now, but only recently got a machine supporting eSATA (as well as the two others). I was previously preferring firewire over usb, for good reasons:

  • usb: Timing buffered disk reads: 84 MB in 3.01 seconds = 27.89 MB/sec
  • firewire: Timing buffered disk reads: 112 MB in 3.00 seconds = 37.33 MB/sec

But I didn't expect this 3 years old disk (possibly more, I don't remember precisely) to perform that well over eSATA:

  • eSATA: Timing buffered disk reads: 216 MB in 3.01 seconds = 71.88 MB/sec

(All results as given by hdparm -t)

Interestingly, smartctl is unable to gather the vendor specific SMART attributes when the disk is attached on eSATA, while it can when on usb.

2010-09-25 17:26:45+0900

p.d.o | 3 Comments »

I/O patterns on ELF binary initialization

[ I meant to finish this article much earlier, but i had to leave it in a half-written draft state for quite some time due to other activities ]

One particular issue that arises with big binary files is that of I/O patterns. It looks like it is not something under the usual scope for both ld.so and programs/libraries, but it can have a dramatic influence on startup times. My analysis is far from complete, would need to be improved by actually investigating ld.so code further, and so far has been limited to libxul.so built from mozilla-central, with the help of icegrind, on x86-64 linux.

As I wrote recently, icegrind allows to track memory accesses within mmap()ed memory ranges. As ld.so does mmap() the program and library binaries, tracking the memory accesses within these mmap()s allows to get a better idea at I/O patterns when an ELF binary is initialized. I only focused on local accesses within a single given binary file (libxul.so) because the case of Firefox loading many files at startup is already being scrutinized, and because most of the non-Firefox files being read at Firefox startup (system and GNOME libraries) are most likely already in the page cache. I also focused on that because it was an interesting case that could be helpful to understand how big (and maybe less big) binaries may be affected by the toolchain (compiler, linker and dynamic linker) and possibly by some coding practices.

For the record, what I did to get these results is to use icegrind and elflog, with further additions to the "sections" file with some output from "objdump -h": I added sections that elflog wouldn't give (such as .plt, .hash, .dynsym, etc.), and even down to the entry level for the .rela.dyn section. The latter is particularly interesting because icegrind only outputs the first access for any given section. To see sequential accesses within that section, you need to split it in smaller pieces, which I did for .rela.dyn entries (each one being 24 bytes on x86-64). Uncommenting some parts of the icegrind code was also useful to track where some accesses were made from, code-wise.

Now, the interesting data:

One of the first accesses is a nullification of a few variables within the .bss section. The .bss section is usually an anonymous piece of memory, that is, a range of mmap()ed memory that is not backed by a file, and filled with zeroes by the kernel (I think it even does that lazily). It is used for e.g. variables that are initialized with zeroes in the code, and obviously, any code accessing these variables would be addressing at some offset of the .bss section. It means the section needs to start in memory at the offset it has been assigned by the linker at build time. This is actually where problems begin.

When the .bss section offset as assigned by the linker doesn't align on a page (usually 4KB), the mmap()ed .bss can't be at that location, and really starts on the next page. The remainder is still mmap()ed from the binary file, and ld.so will itself fill that part. As the .bss section doesn't start on a page boundary, any write at this location will trigger the kernel reading the entire page. This means one of the first set of data being read from the file is the end of the section preceding .bss, and the beginning of the following one. Most likely, respectively the .data and .comment sections.

While this probably doesn't matter much when the binary file is small, when it is big enough, reading in a non sequential manner will trigger hard disk seeks, and we all know how they can hurt performance. Although thankfully, cheap SSDs should be coming some day, in the meanwhile, we still need to cope with the bad performance. The interesting part is, the .bss section is really empty in the binary file, so its "virtual" memory address could be anywhere. Why the linker wouldn't align it at a page boundary without having to resort to a linker script is beyond me.

The next accesses go back and forth between .dynamic, .gnu.hash, .dynstr, .gnu.version_r, .gnu.version and .dynsym. These are probably all related to symbol version resolution and DT_NEEDED library loading. While most of these sections are at the beginning of the file (not necessarily in the order they are read from), the .dynamic section is much nearer to the end, but way before .data, so that it won't even have been loaded as a by-product of the .bss section loading.

After that, the .rela.dyn section is read, and for each relocation entry it contains, the relocations are being applied. Relocations is one of the mechanisms by which position independent code (PIC) is made possible. When a library is loaded in memory, it is not necessarily loaded at the same address every time. The code and data contained in the library thus need to cope with that constraint. Fortunately, while the base address where the library is mmap()ed in memory is not necessary constant, the offsets of the various sections are still as codified in the binary. The library code can thus directly access data at the right offset if it knows the base offset of the library (which is what is done on the x86 ABI), or if it knows where the current instruction is located (which is what is done on the x86-64 ABI).

"Static" data (initialized in e.g. a const or a global variable, or, in C++ case, vtables), on the other hand, may contain pointers to other locations. This is where relocation enters the scene. The .rela.dyn section contains a set of rules describing where in the binary some pointers need to be adjusted depending on the base library offset (or some other information), and how they should be updated. ld.so thus reads all .rela.dyn entries, and applies each relocation, which means that while .rela.dyn is being read sequentially, reads and writes are also performed at various places of the binary, depending on the content of the .rela.dyn entries.

This is where this gets ugly for Firefox: there are near 200000 such relocations. On x86-64 an entry is 24 bytes (12 on x86), and each of these is going to read/write a pointer (8 bytes on x86-64, 4 on x86) at some random (though mostly ordered) location. The whole .rela.dyn section not being read ahead, what actually happens is that it is read in small batches, with seeks and reads of other data at various locations in between. In libxul.so case, this spreads over .ctors, .data.rel.ro, .got, and .data. The relocation entries are somehow ordered by address to be rewritten, though they occasionally jump backwards. Some of these relocations also appear to be touching to .gnu.version, .dynsym and .dynstr, because their type involves a symbol resolution.

Once .rela.dyn relocation have been dealt with comes .rela.plt's turn. The principle is the same for this section: entries describe what kind of relocation must be done where, and how the result must be calculated. The scope of this section, though, is apparently limited to .got.plt. But before explaining these relocations, I'll explain what happens with the PLT.

The PLT (Procedure Linkage Table) is used when calling functions from external libraries. For example, in a Hello World example, the PLT would be used for calls to the puts function. The function making the call would in fact call the corresponding PLT location. The PLT itself, on x86 and x86-64, at least, consists of 3 instructions (I'll skip the gory details, especially for x86, where the caller needs to also set some register before calling the PLT). The first instruction is the only one to be called most of the time: it reads the final destination in the .got.plt section, and jumps there. That final destination, obviously, is not fixed in the library file, since it needs to be resolved by its symbol. This is why the two subsequent instructions exist : originally, the destination "stored" in the .got.plt section points back to the second instruction ; the first instruction will effectively be a nop (no operation), and the following instructions will be executed. They will jump into code responsible for symbol resolution, update of the .got.plt entry for the next call, and call of the real function.

But pointing back to the second instruction is like the pointers in static data we saw above : it's not possible in position independent code. So, the .rela.plt relocations are actually filling the .got.plt section with these pointers back to the PLT. There are a tad more than 3000 such relocations.

All these relocations should be going away when prelinking the binaries, but from my several experimentations, it looks like prelinking only avoids relative relocations, and not the others, while it technically could skip all of them. prelink even properly applies all the relocations in the binary, but executing the binary rewrites the same information at startup for all but relative relocations. That could well be a bug in either ld.so not skipping enough relocations or prelink not marking enough relocations to be skipped. I haven't dug deep enough in the code to know how prelinking works exactly. Anyways, prelinking is not a perfect solution, as it also breaks ASLR. Sure, prelink can randomize library locations, but it relies on the user or a cron job doing so at arbitrary times, but that's far from satisfying.

An interesting thing to note, though, is that a good part of the relocations prelinking doesn't rid us of in libxul.so (more than 25000) are due to the cxa_pure_virtual symbol, which is used for, well, pure virtual methods. In other words, virtual methods that don't have an implementation in a given class. The cxa_pure_virtual function is set as method in the corresponding field(s) of the class VTABLE in the .data.rel.ro section. This function is provided by libstdc++, and as such, is dynamically linked. But this function is just a dummy function, doing nothing. Defining an empty __cxa_pure_virtual function to be included in libxul.so makes these relocations become relative, thus taken care of by prelinking.

After all relocations occur, the library initialization itself can begin, and the content of the .init section is executed. That section, indirectly, executes all functions stored in the .ctors section. This includes static initializers, which are unfortunately called backwards, as Taras pointed out already. Each of these static initializers are also accessing various locations in the .data or .bss sections, which may or may not have already been loaded during the relocation phase. The execution of these initializers will also (obviously) read various pieces of the .text section (despite its name, it contains executable sections, i.e. functions code).

The initialization of the library ends there, and no access should happen until a function from the library is called. In libxul.so case, XRE_main is first called, then many other functions, but that's another story. All that needs to be remembered about the startup process past this point is that the .text section will be read heavily, as well as the various data, got, plt and dynamic symbol sections, in a very scattered way. While most of these sections may have been retrieved in memory already, as a byproduct of the various initialization processes described above, some may have not, increasing even more the need to seek at all places in the binary file.

Now the main problem with all these I/O patterns at startup, is that it seems the only way reorganizing the binary layout may have a visible impact is by considering all the above, and not only a part of it, because only addressing a part of it is very likely to only move part of the problem to a different layer.

All in all, making sure the relevant sections of libxul.so are read by the kernel before ld.so enters the game is a good short-term solution to avoid many seeks at startup.

2010-07-14 18:37:13+0900

mozilla, p.m.o | 7 Comments »

Iceweasel 4.0 beta 1を公開

Firefoxの最新ベータ版が公開された為、Iceweaselの4.0beta1バージョンをアップロードしました。unstableでもexperimentalでもなく、別のレポジトリへ。ですので、下記の行をsource.listに追加して下さい。

deb http://mozilla.debian.net/packages/ ./

今の所、x86とx86-64(amd64)のパッケージしか入っていません。

unstableかexperimentalのバージョン(ベータじゃない方)を使用し続けたい場合は次のトリックを試してみて下さい。上記のレポジトリからiceweaselをインストールしずに、

  • xulrunner-1.9.2をインストール,
  • iceweaselをダウンロード(インストールではなく),
  • 次のコマンドを実行:dpkg-deb -x iceweasel_4.0b1-0_*.deb /some/directory,
  • シンボリックリンクを作成:ln -s /usr/lib/xulrunner-2.0 /some/directory/usr/lib.

それでIceweaselのベータバージョンは/some/directory/usr/bin/iceweaselで起動が可能になります。以前のバージョンでもこのトリックを利用出来るはずです。

2010-07-09 21:34:41+0900

firefox, xulrunner | No Comments »

Iceweasel 4.0 beta 1 preliminary packages for Debian, and a nice trick

Since this blog is now syndicated on Planet Mozilla, a little background for its readers: Iceweasel is the name under which Firefox is distributed in Debian. This is an unfortunate detail due to copyright issues with the Firefox logos that have been solved recently. Work is under progress to get Firefox back in Debian (I do have good hope this will be possible).

Anyways, I've started to work on getting Iceweasel in shape for the 4.0 release in a few months. The packaging being in a good enough shape, I am hereby making available some preliminary packages (meaning there is still some more work needed for proper packaging) for the first beta release.

The packages are available in a separate repository, which you need to add to your sources.list:

deb http://mozilla.debian.net/packages/ ./

Only x86 and x86-64 (amd64) packages are available for now. As far as I tested it, it works as well as the official Firefox 4.0beta1 binaries, though some xpcshell tests failed, and I haven't got reftests working yet.

If you still wish to use a current version of iceweasel (i.e. non-beta), but want to try this beta, here is the nice trick: Instead of installing iceweasel from the above mentioned repository,

  • Install xulrunner-2.0,
  • Download the iceweasel package (don't install),
  • Run the following command: dpkg-deb -x iceweasel_4.0b1-0_*.deb /some/directory,
  • Create a necessary symbolic link: ln -s /usr/lib/xulrunner-2.0 /some/directory/usr/lib.

Now you can start the Iceweasel beta with /some/directory/usr/bin/iceweasel. This trick should work with older versions of iceweasel, too.

2010-07-09 20:59:08+0900

firefox, xulrunner | 46 Comments »

++age

(gdb) p/x age
$1 = 0x20

2010-06-16 10:05:31+0900

me, p.d.o | 5 Comments »

Playing with icegrind

In the past few days, I've been playing with icegrind, a little valgrind plugin that Taras Glek wrote to investigate how Firefox startup spends its time in libxul.so reading/initialization, mostly. I invite you to check out his various posts on the subject, it's an interesting read.

After some fiddling with the original icegrind patch in the bug linked above, I got some better understanding on the binary initialization phase (more on that in another post), as we could call it, and hit some problems due to problems in icegrind and elflog. The latest version of the icegrind patch as of writing solved my main problem half way (though it needs further modifications to work properly, see below).

What icegrind actually does is to track memory accesses in mmap()ed memory. When the program being profiled mmap()s a file, icegrind looks for a corresponding "sections" file next to it (e.g. "libxul.so.sections" for "libxul.so"). The "sections" file contains offsets, sizes, and sections names, that will be used by icegrind to report the accesses. Whenever the profiled program makes memory accesses (whether it is for instructions or data) within the mmap()ed range, icegrind will add the corresponding section name in a "log" file (e.g. "libxul.so.log" for "libxul.so"). Please note it will only do so for the first access in the given section.

To generate section information for ELF files, Taras also hacked an elflog program that scans an ELF binary (program or library) and will output sections for symbols present in its symtab. This means the binary needs not to be stripped, though the full fledged debugging symbols are not needed. It outputs the sections names in a form that would be reusable in a linker script after a build with the "-ffunction-sections" and "-fdata-sections" compiler options, but that's mostly irrelevant when what you are after is only to see what is going on, not to reorder the sections at link time. There are glitches in the way elflog works that makes the section names for .bss symbols wrong (they will start with .symtab, .shstrtab, .comment, etc. instead of .bss). Also, technically, the .bss section is not mapped from the file.

Note icegrind has rough edges, is still experimental, and isn't very user friendly, as in unix permissions, because its input and output files need to be next to the file being mmap()ed, and when that is a library in /usr/lib, well, you need write access there ; or you need to copy the library in a different directory and adjust LD_LIBRARY_PATH. Anyways, it's already useful as it currently is.

If you want to play with it yourself, here are steps that worked well for me:

  • svn co svn://svn.valgrind.org/valgrind/trunk valgrind -r 11100
    When I first tried icegrind, valgrind trunk was broken ; revision 11100 is known to work properly, at least for icegrind.
  • cd valgrind
  • wget -O - -q https://bug549749.bugzilla.mozilla.org/attachment.cgi?id=449748 | patch -p0
    You need to open icegrind/ice_main.c, go on the last line of the track_mmap function and replace mmaps with dest_mmaps.
  • mkdir icegrind/tests ; touch icegrind/tests/Makefile.am
    The valgrind build system is a bit lunatic.
  • libtoolize ; aclocal ; automake --add-missing ; autoreconf
  • ./configure; make
  • wget http://hg.mozilla.org/users/tglek_mozilla.com/startup/raw-file/6453ad2a7906/elflog.cpp
  • g++ -o elflog elflog.cpp -lelf
    You will need the libelf-dev package.
  • make install ; install -m 755 elflog /usr/local/bin
    as root, to install in /usr/local.

Once you're done with this setup, you are ready to start playing:

  • elflog --contents libxul.so > libxul.so.sections
    Be aware that if libxul.so is a symbolic link pointing to a file in another directory, as it happens in the dist/bin directory in mozilla builds, the "sections" file needs to be in that other directory.
  • LD_LIBRARY_PATH=. valgrind --tool=icegrind ./firefox-bin -P my-profile -no-remote about:blank

Obviously, you don't have to play around with Firefox. You can try with other libraries, or even programs. You'll see in a subsequent post, however, that to get more interesting information, the elflog output is unfortunately not enough.

2010-06-08 18:46:42+0900

mozilla, p.m.o | 1 Comment »