Preloading for dummies
We know disk seeks hurt. A few weeks ago, a 20 line patch made the news because it was cutting startup time on Windows significantly. The patch basically preloads the 2 main libraries used by Firefox.
There has been an open bug for a while to try to get rid of the startup script on UNIX systems, that would allow the same kind of trick on these systems. Unfortunately, it's too late in the 4.0 development process to get somewhere with these. But what about a stupid one-liner preloading all Firefox libraries ? It turns out to be a simple way to improve things quite significantly:
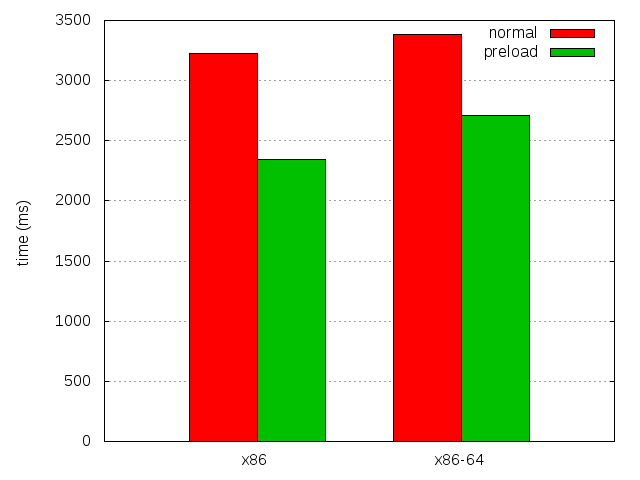
| 4.0b8 | 4.0b8 with preload | Difference | |
|---|---|---|---|
| x86 | 3,228.76 ± 0.57% | 2,347.18 ± 0.67% | 881.58 (27.30%) |
| x86-64 | 3,382.0 ± 0.51% | 2,709.82 ± 0.54% | 672.18 (19.86%) |
Please note that the above values are for plain 4.0b8 startup. Since then, relocations packing landed, which reduces the binaries size, thus helping further, since there is less data to preload.
We could try to preload only the parts that we need, but that would mean a bigger change, with absolutely no chance of getting in before 4.0.
Now, to help my cause of having this patch applied before 4.0, let's see why it works so well. There are 11 .so files in the Firefox directory, some of which are really small, and a few being bigger, libxul.so being the champion. Of these 11 files, only 2 don't end up being entirely read by kernel readahead on both x86 and x86-64, and most probably all other Linux platforms:
| File name | File size (blocks) | Read ahead size (pages) | Proportion |
|---|---|---|---|
| x86 | |||
| libnss3.so | 214 | 68 | 31.78% |
| libxul.so | 5,304 | 4,787 | 90.25% |
| others | 288 | 288 | 100% |
| total | 5,806 | 5,143 | 88.58% |
| x86-64 | |||
| libnss3.so | 259 | 81 | 31.27% |
| libxul.so | 7,244 | 5,874 | 81.09% |
| others | 333 | 333 | 100% |
| total | 7,836 | 6,288 | 80.25% |
In the above table, a block and a page are both 4096 bytes.
Even when the filesystem is fragmented, there are good chances that the files are stored in chunks of significant size, and that these chunks are more or less ordered on disk. In our case, where the files are read in great part during startup (more than 80%), it's obviously going to be much faster to read them entirely than to randomly read small chunks from them. Which is why it works so well. Even on extremely fragmented file systems, I don't expect this stupid trick to make things worse (but you are free to prove me wrong).
If these files weren't almost entirely read by the kernel during startup, there would have been chances that the extra reads had outweighed the saved disk seeks, making the technique ineffective. When we get to the point where we actually reorder the objects or functions in the main library, this little patch will likely lose its positive effect. Then, it will become important to preload more cleverly, and limit ourselves to the used parts only.
2011-02-08 18:55:56+0900
