Reducing Firefox startup I/O in libxul.so
I've been working, during the past few months, on Firefox startup performance, with a particular focus on I/O, even more particularly focusing on the core library: libxul. As I've been saying all along, my current work is focused on GNU/Linux systems, though some of it has a direct impact on OSX, and similar work is most probably applicable on Windows.
The data in this post has been gathered with the same setup as described in the introduction of previous post. That post also contains a view of how much impact I/O has on startup. Unfortunately, the data gathered here pre-dates the findings about the combined effect of I/O and CPU scaling, making the results here completely dependent on my system, though the figures are still interesting. For comparison, when I was doing preliminary timings using the Core 2 Duo instead of the i7 system, I was experiencing greater improvements in terms of % of startup time.
All startup times in this post are cold cache (after boot) startup times. For reference, here are the startup times for a vanilla Firefox 4.0b8 build on both x86 and x86-64:
| Average startup time (ms) | |
|---|---|
| x86 | 3,228.76 ± 0.57% |
| x86-64 | 3,382.0 ± 0.51% |
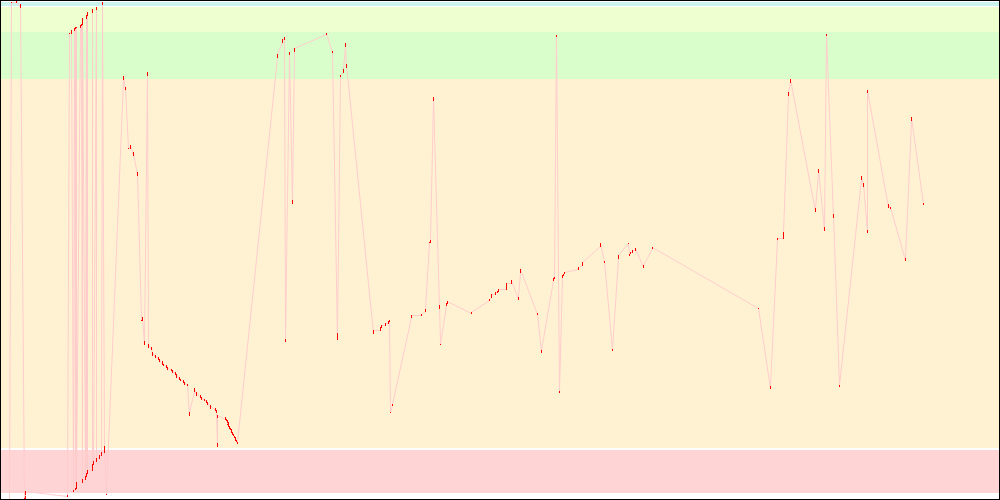
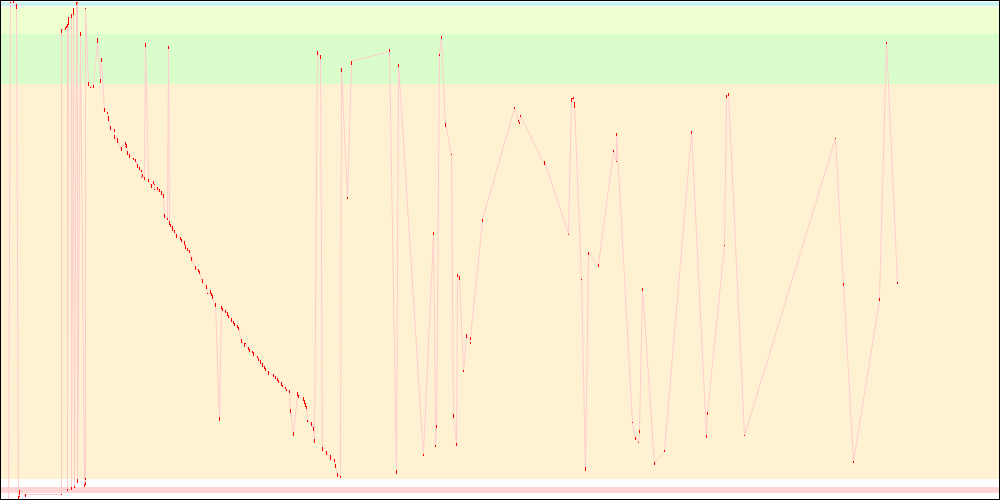
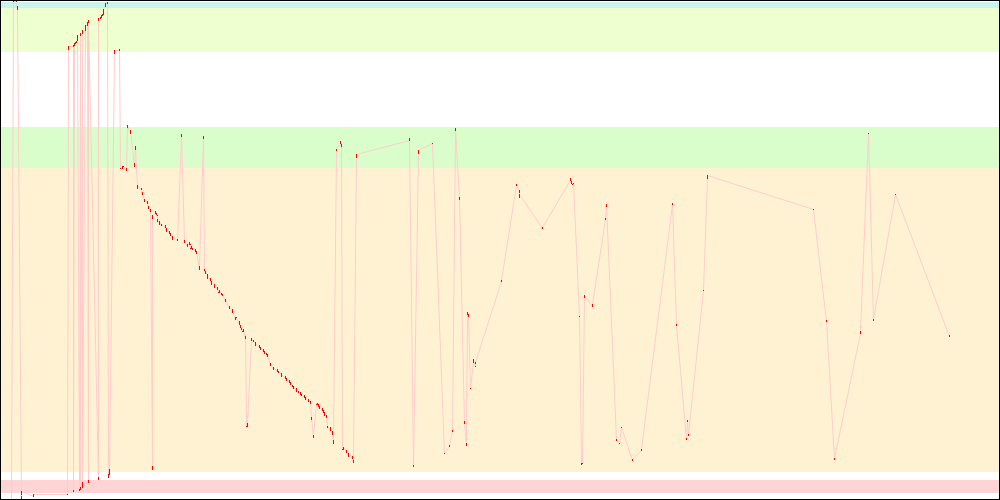
Thanks to a systemtap script I will detail in a subsequent post, I also got what is being accessed from libxul.so and when, and got the following access pattern graphs (click to see at bigger sizes):
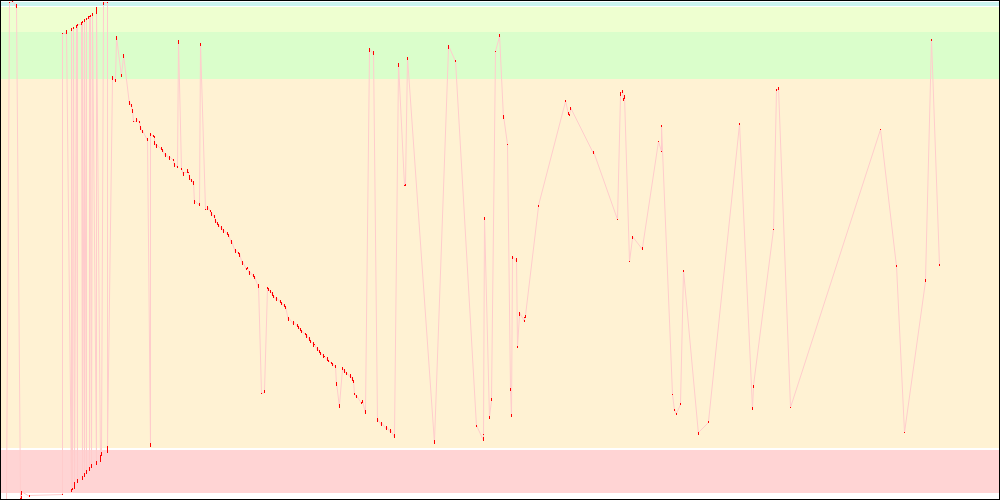
libxul.so access patterns on x86
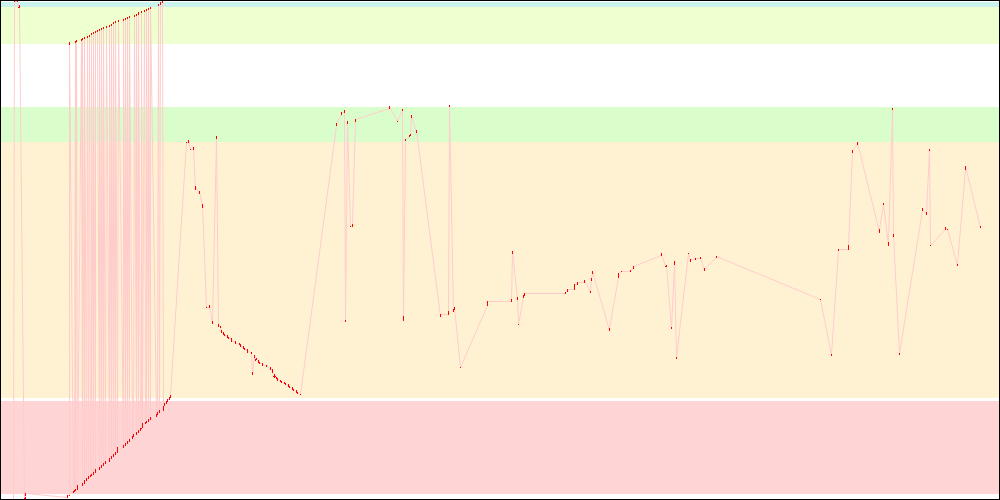
libxul.so access patterns on x86-64
For those following this blog, it might look kind of familiar, though the graphs here have been simplified for the purpose of this post.
- The red dots represent pages read from disk.
- The light red lines somehow represent disk seeks within the file, though not always, as sometimes the disk seeks to entirely different locations for other files. It however helps visualizing how things are going.
- The coloured arrays represent respectively
.rel.dyn/.rela.dyn,.text,.rodata,.data.rel.roand.datasections from the libxul.so file.
Please note that these graphs are not necessarily in full correlation with the startup times, first because I didn't average over 50 startup like for the timings, and second because systemtap might be introducing some noise. They are still helpful to visualize what is happening with the various patches I'll be testing below. Please also note that all graphs for a given architecture have the same horizontal axis scale, though the scale itself is not specified.
Another interesting metric to follow along the way is the amount of data the kernel reads from the libxul.so file during startup. These are obtained from the same systemtap script. For the same vanilla 4.0b8 builds as above, this is what we get:
| Pages read | Bytes read | |
|---|---|---|
| x86 | 4,787 | 19,607,552 |
| x86-64 | 5,874 | 24,059,904 |
Static Initializers
One big part of the startup time in the above graphs looks like, in the thumbnails, as a decreasing straight line, and it is the part of the library initialization that runs static initializers. One way to decrease I/O at startup could thus be to reduce the number of static initializers.
When I started investigating them, there were 237 static initializers, 147 of which were due to cycle collection globals. We landed some patches from bug 569629 and bug 502176, which got the overall number down, but in 4.0b8, it jumped to 316 while the number of cycle collection globals went up to 181... while is kind of depressing, and means I'll have to go back to my patch queue to see what can be done about these, and will do some writing about how innocent looking constructs can create static initializers, and how to avoid them.
I however came up with a hack to reduce the number of static initializers due to cycle collection to only one, which already gives a good reduction. Here are the startup results for 4.0b8 with the patches attached to that bug applied (plus a two-liner patch due to two additional cycle collected classes):
| Average (ms) | Pages read | Bytes read | |
|---|---|---|---|
| x86 | 3,216.1 ± 0.59% | 4,656 | 19,070,976 |
| x86-64 | 3,488.14 ± 0.75% | 5,759 | 23,588,864 |
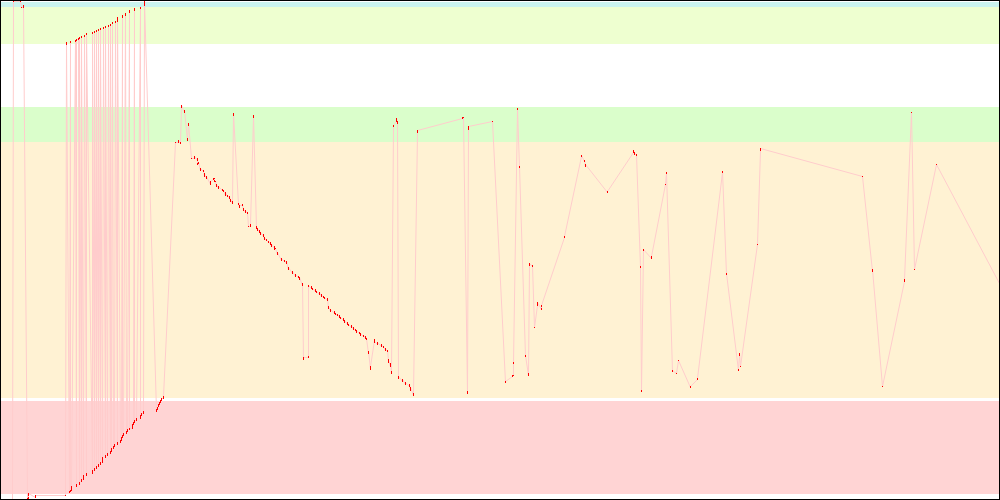
The results are not exactly thrilling, and there actually is a regression on x86-64. While the amount of data read slightly decreased, the startup time regressed because of the I/O patterns.
libxul.so access patterns on x86
libxul.so access patterns on x86-64
While I/O due to static initializers was reduced (and now has a tortured shape), the remaining I/O got much worse because some things that were previously read during static initialization are not anymore. Static initializers reduction thus looks like a worthwhile goal, because it represents a large portion of the startup time, but it needs some help in order to be more efficient.
Reordering objects
Another way to reduce I/O at startup is to arrange the binary such that a read-ahead from the kernel grabs something that is going to be required soon. Taras investigated this a long time ago, but this unfortunately requires a toolchain change. Well, technically, it doesn't, but GNU ld is so much of a pain to reorder functions that it's simpler to wait for Mozilla to switch to gold. In the interim, there is still a way to get some nice improvements in the binary layout: reordering objects.
On both OSX and GNU/Linux, the static linker doesn't do much in terms of binary layout, and just takes the files in the order they come on the command line. The OSX linker has some optimizations for data sections, and newer versions of the GNU linker have some other niceties, but overall, the order on the command line still prevails.
Using Taras' icegrind, I gathered the order in which object files' code sections are being accessed during startup and hacked the build system to reorder the objects files on the static linkage command line.
The improvements look quite good:
| Average (ms) | Pages read | Bytes read | |
|---|---|---|---|
| x86 | 2,939.18 ± 0.81% | 4,129 | 16,912,384 |
| x86-64 | 3,247.64 ± 0.68% | 5,254 | 21,520,384 |
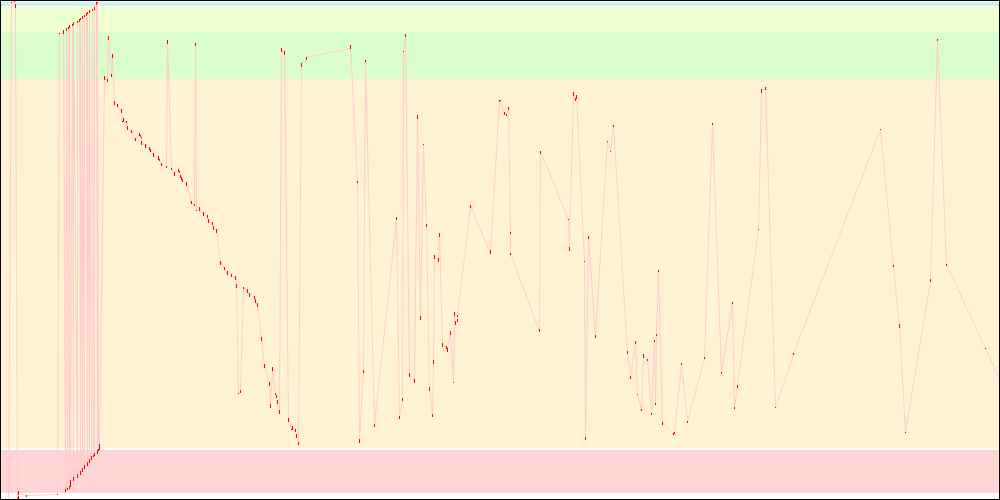
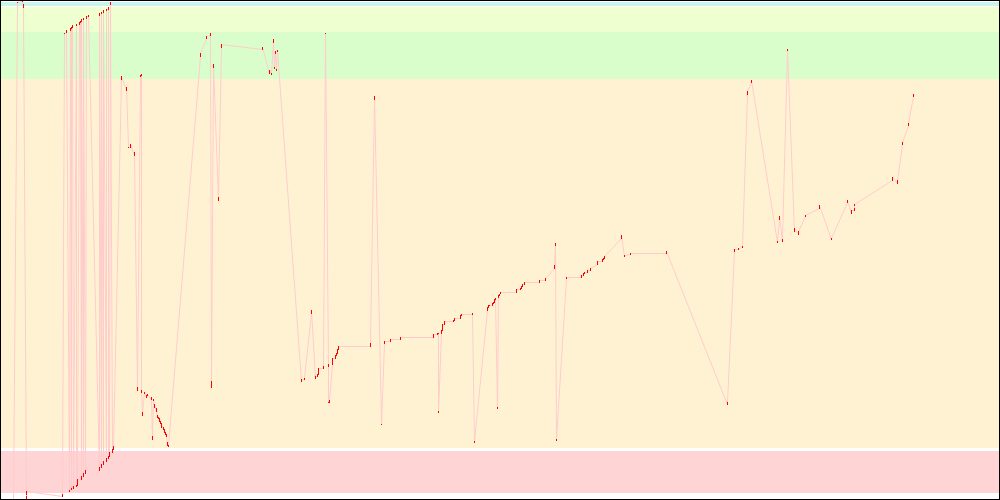
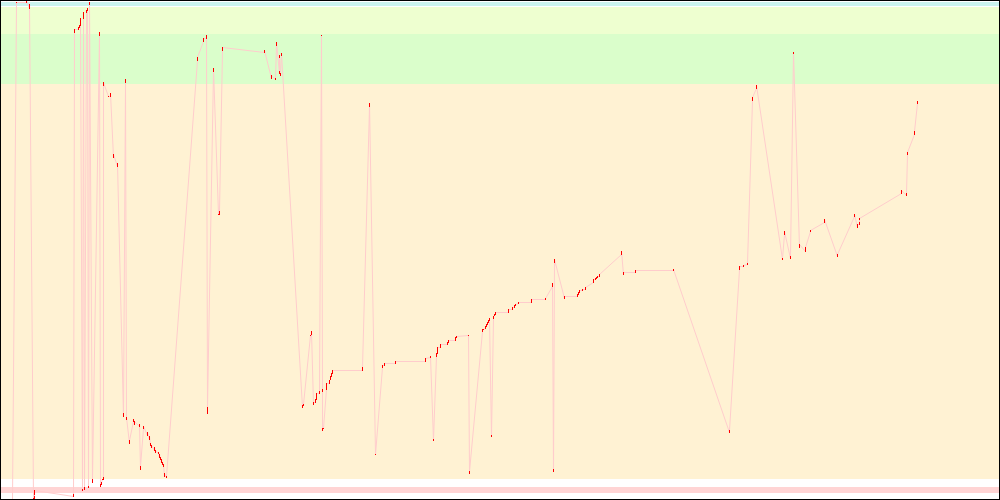
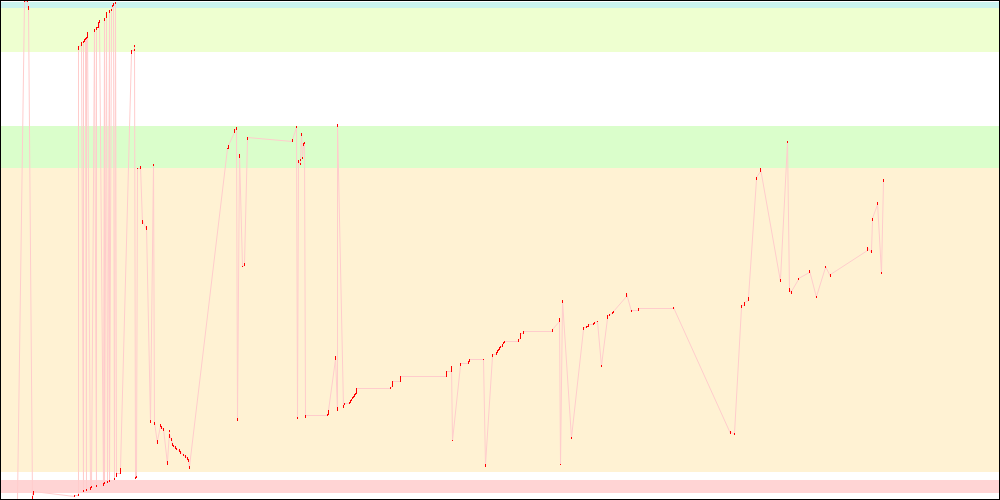
I/O patterns look better, too:
libxul.so access patterns on x86
libxul.so access patterns on x86-64
The profile used to get the objects order here was actually quite old, which means getting a new profile from 4.0b8 would have given better results. Further tweaking would make them look even better.
I only tested a couple times but this reordering also seems to improve OSX startup times, though an OSX-specific profile would be better.
Combining both
We saw earlier that the reduction of static initializers lead to more I/O later on, making it not that interesting. But what happens when the binary layout is improved as above? It turns out that gives a bigger win:
| Average (ms) | Pages read | Bytes read | |
|---|---|---|---|
| x86 | 2,851.06 ± 0.54% | 4,125 | 16,896,000 |
| x86-64 | 3,085.04 ± 0.76% | 5,230 | 21,422,080 |
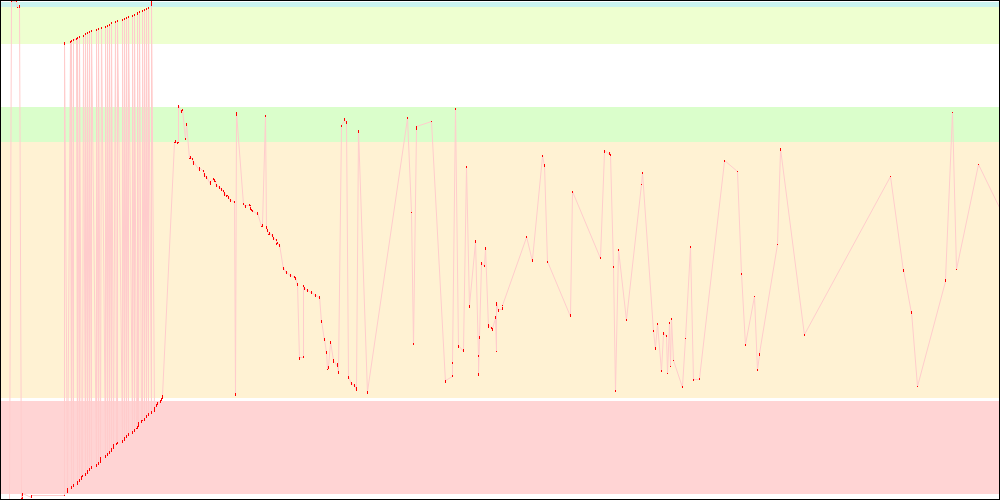
As above, the profile is quite old, but the I/O patterns still look much better:
libxul.so access patterns on x86
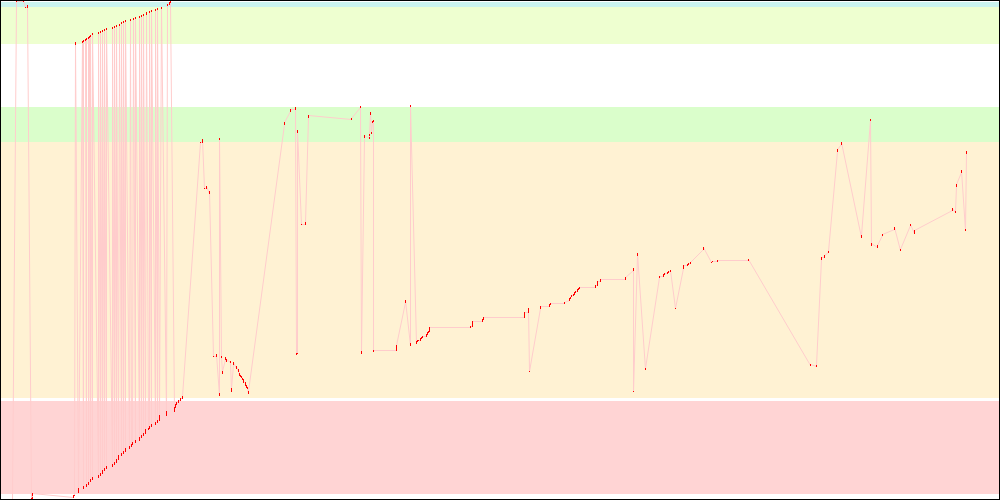
libxul.so access patterns on x86-64
There is another pending work to reverse the order of the static initializers, which I expect would improve things slightly. I didn't time it, however.
Packing relocations
Yet another way to reduce I/O at startup is to avoid going back and forth between data sections and relocation sections of libxul, which can be seen on the left side of all the graphs above. While it doesn't entirely do so, the tool I came up with (corresponding bug, and some explanations) reduces these zigzags and also reduces the dynamic relocations section size significantly (reducing the binary size is also an obvious way to reduce I/O).
| Average (ms) | Pages read | Bytes read | |
|---|---|---|---|
| x86 | 3,149.32 ± 0.62% | 4,443 | 18,198,528 |
| x86-64 | 3,191.58 ± 0.62% | 4,733 | 19,386,368 |
The improvement is greater on x86-64 because of how much bigger the relocation section is on this architecture, as explained earlier.
libxul.so access patterns on x86
libxul.so access patterns on x86-64
The I/O patterns are not quite optimal there, which can be seen when looking closely at the above graphs, yet giving a nice improvement, while only altering the envelope. There are plans to make the hack tool even better in the future.
All of the above
Overall, we get a substantial startup time improvement by looking at only one file, while there is still room for further improvement.
| Average (ms) | Pages read | Bytes read | |
|---|---|---|---|
| Before | |||
| x86 | 3,228.76 ± 0.57% | 4,787 | 19,607,552 |
| x86-64 | 3,382.0 ± 0.51% | 5,874 | 24,059,904 |
| After | |||
| x86 | 2,820.84 ± 0.83% | 3,782 | 15,491,072 |
| x86-64 | 2,884.36 ± 0.52% | 4,090 | 16,752,640 |
libxul.so access patterns on x86 (before)
libxul.so access patterns on x86 (after)
libxul.so access patterns on x86-64 (before)
libxul.so access patterns on x86-64 (after)
2011-01-04 20:06:58+0900
