Getting figures on startup libxul I/O, and static initializers
As we saw in my previous analysis, there are several parts of the library initialization process that have a direct impact on startup performance, especially on big applications like Firefox. Understanding the various issues involved surely is important, and visualizing them and their evolution (through logs or graphs, the latter being more appealing to the eye) may be helpful.

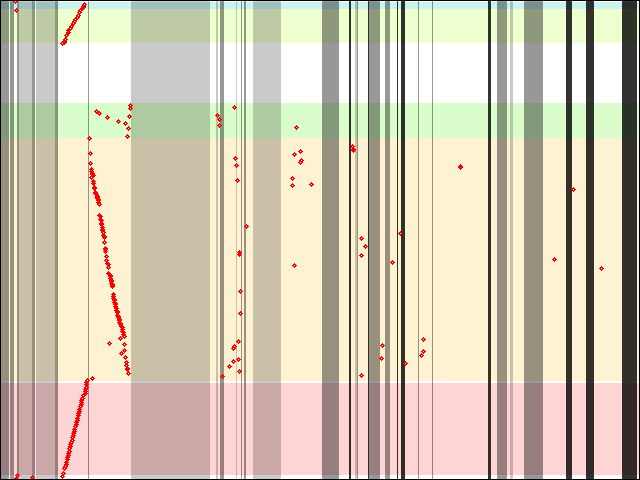
The above graph represents a whole lot of information about how libxul.so is accessed during startup.
[Disclaimer: there are problems with the data collection that don't help for the best accuracy. I'll talk about them in a subsequent post.]
- The horizontal axis represents time, though as the data was gathered while the system and applications are loaded off a fast SSD drive, it does not show how some I/O can have a big impact on the startup time. The timeline also stops at the first access to an html test file given on the command line, which actually (and unfortunately) doesn't account for the whole startup.
- The vertical axis is the offset within libxul.so where I/O occur, start of the file being at the bottom.
- The red dots/bubbles represent each I/O. Access length is actually not represented for reasons I'll give in the subsequent post.
- The horizontal coloured bars represent various important sections of the libxul.so file. From bottom to top,
.rela.dyn,.text,.rodata,.data.rel.ro, and.data. Note the huge gap between.rodataand.data.rel.rois.eh_frame(the data was gathered on x86-64, but x86 patterns are close enough that I didn't bother) - The vertical grayed areas represent time where I/O occur to other files than libxul.so. The lightest shade represents I/O on system files, the slightly darker one I/O on files in the Firefox directory, and the darkest one (almost black) I/O on profile files. Each of these areas starts on the beginning of the first access to a file in a given category and ends on the end of last access to a file within the same category. They obviously don't relate to where code is being executed, but somehow to where a rotating hard disk head might be (though fragmentation makes that more or less irrelevant). The data was gathered after a total flush of the page cache, which is biased because on a typical desktop, the page cache will already be populated with most system libraries Firefox requires.
The leftmost part of the graph is really nothing new or surprising if you read Taras' blog and my previous post: Initialization of other (system) libraries, followed by relocations, then static initializers.
One of the things this graph shows that was only a hunch before is that the relocation process ends up reading the whole .data.rel.ro and .data sections as a byproduct. Or at least, it reads enough of them that it's not read again later (even on longer sessions, accesses to .data.rel.ro and .data don't show up).
It also appears that .rodata is accessed in an unordered manner from the static initializers, but not enough to cover the whole section. Also, as Taras explained, static initializers are run backwards, starting with the last one. Some of them also call some functions within libxul.so, which explains why the static initialization phase accesses in .text are not entirely sequentially backwards.
Follows accesses to a bunch of different files, and calls to functions spread accross the .text section.
There are several places that can help improving startup time (some are Linux only, but others echo on Windows and Mac ; please note none of the following is really new):
- Get rid of static initializers. More on this below.
- Avoid going back and forth during relocation process. We're going to test how much good
madvise()will do. - Improve the relocation process. We are planning to experiment relocation sections packing/compression. The ongoing deCOMtamination process may help reducing the amount of relocations, too, by removing the need for some vtables (around 75% of the relocations are for vtables entries).
- Improve code layout. Taras initialized this with icegrind, aiming at reordering functions, which requires help from the linker. Before that, I'd like to try reordering object files and see how it helps. This should be made easier by Kyle's fakelibs.
- Reduce I/O to other files. A great part of that is being addressed with omnijar and jar reordering, and more attempts at reducing I/O from e.g. profile files are in progress.
I'm currently working on reducing the number of static initializers, and wanted to have a more accurate view on how this reduction affects startup. Unfortunately, mozilla-central is a moving target, and some patches I was working on already don't apply anymore, so I only gathered data after the first (big) batch of static initializer removal: cycle collection induced ones (60% of all the static initializers).
There are obvious upside and downside to static initializers removal: the upside is that backwards I/O tending to be suboptimal, reducing the amount of backwards seek should help. The downside is that anything that is not read during the static initialization phase and thus put in page cache may be required at a later time. For example, if a function is a few bytes or kilobytes after a static initializer and is used during startup, its code will be cached when reading the static initializer because of readahead. If the static initializer is removed, this function will still be accessed, thus itself triggering an I/O, but later in the startup process. The main question is whether the upside overtakes the downside.

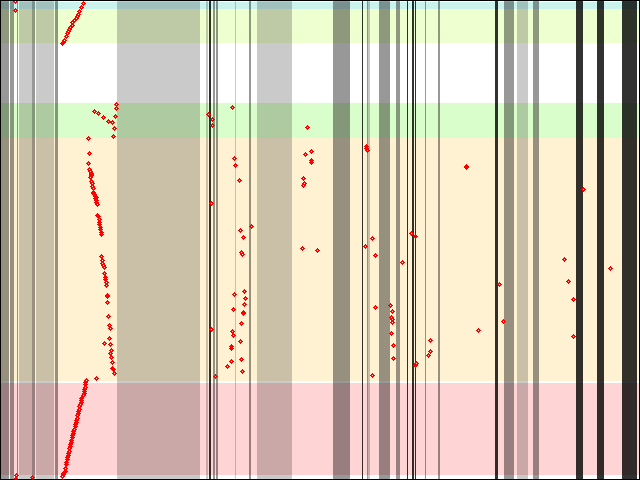
The above graph represents the same kind of data as the first graph (be aware the timescale is most probably different, and irrelevant anyways), with 179 static initializers less, out of 296 (when I started, there were "only" 237 static initializers, *sigh* ; sure cycle collection induced ones grew, but there's also 27 more that are not cycle collection). If you take a closer look and compare both graphs, you'll see that apart from the obvious static initializers reduction, there are, as expected, much more I/O later. I won't ask you to count how many more, fortunately, computers and scripts are our friends here.
Initially, there were 176 accessed in the leftmost part, and 56 subsequent accesses. After the static initializer reduction, the leftmost part got reduced to 136, and the subsequent part went up to 85. Overall, I now get 221 accesses instead of 232, which may or may not be an actual (direct) win, depending on disk fragmentation, and depending how spread the accesses are.
One figure that may help getting an idea how spread they are is to add all the different seeks happening within libxul.so alone. Doing so gives the following results:
- Initially: 815,951,659 forward ; 620,941,312 backwards ; 1,436,892,971 overall
- After static initializers reduction: 828,703,162 forward ; 617,279,488 backwards ; 1,445,982,650 overall
Overall, the after static initializers reduction result might be worse than before. Not even counting on the fact that backwards seeks are supposedly worse than forward seeks (I seem to remember reading something like this a while ago, factual information would be appreciated).
All in all, I'm afraid the static initializers reduction will only have a visible impact when combined with functions or objects reordering, and static initializers grouping.
I will follow up when I get the number further of static initializers down, in other words, once I rebased my work on the revision I was testing. I'd also like to make the graphs less static.
2010-09-30 16:30:28+0900
