Ccache efficiency on Mozilla builders
In the past two blog posts, I've detailed some results I got experimenting with a shared compilation cache. Today, I will be exploring in some more detail why ccache is not helping us as much as it should.
TL;DR conclusion: we need to be smarter about which build slaves build what.
Preliminary note: the stats below were gathered over a period of about 10 days after the holidays, on several hundred successful builds (failed builds were ignored ; this is skewed, but we don't have ccache stats for those).
Try builds
Try is a special repository. Developers push very different changes on it, based on more or less random points of mozilla-central history. But they'd also come back with different iterations of a patch set, and effectively rebuild mostly the same thing. One could expect cache hit rates to be rather low on those builds, and as we've seen in the past posts, they are.
But while the previous posts were focusing on ccache vs. shared cache, let's see how it goes for different platforms using ccache, namely linux64 and mac, for one type of build each:
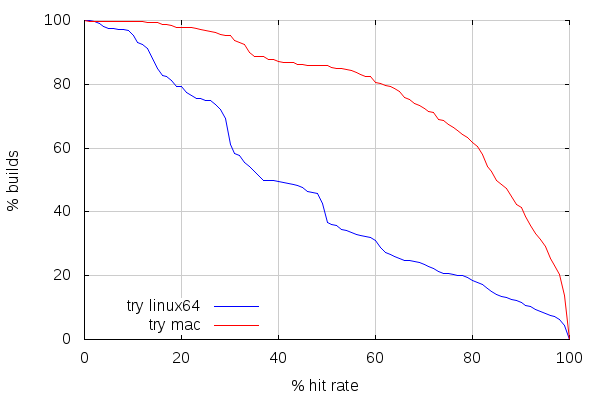
Here comes the surprise. Mac builds are getting a decent cache hit rate on try. Which is kind of surprising considering the usage pattern, but it's not what's the most interesting. Let's focus on why mac slaves have better hit rates than linux slaves.
And here's the main difference: there are way less mac slaves than there are linux slaves. The reason is that we do a lot of different build types on the linux slaves: linux 32 bits, 64 bits, android, ASAN, static rooting hazard analysis, valgrind, etc. We have 663 linux slaves and 23 mac slaves for try (arguably, a lot of the linux slaves are not running permanently, but you get the point), and they are all part of the same pool.
So let's look how those try builds I've been getting stats for were spread across slaves:
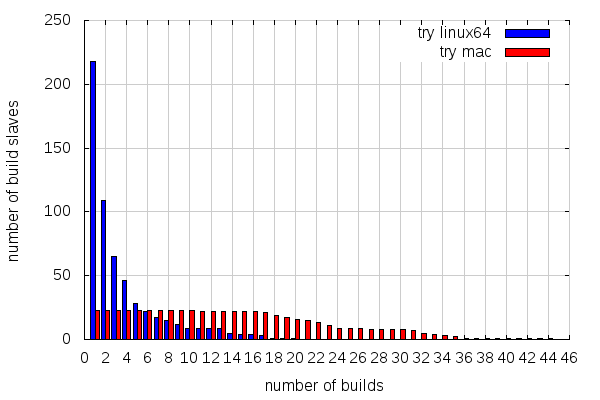
This is not the best graph in the world, but it shows how many slaves did x builds or more. So 218 linux slaves did one build or more, 109 did two builds or more, etc. And there comes the difference: half of the linux slaves have only done one linux64 opt build, while all the mac slaves involved have made at least 10 mac opt builds!
Overall, this is what it looks like:
- 218 slaves for 587 builds on linux64 try (average: 2.7 builds per slave)
- 23 slaves for 563 builds on mac try (average; 24.5 builds per slave)
Let's now compare linux builds cache hit rates for slaves with 5 builds and more, and 10 builds and more:
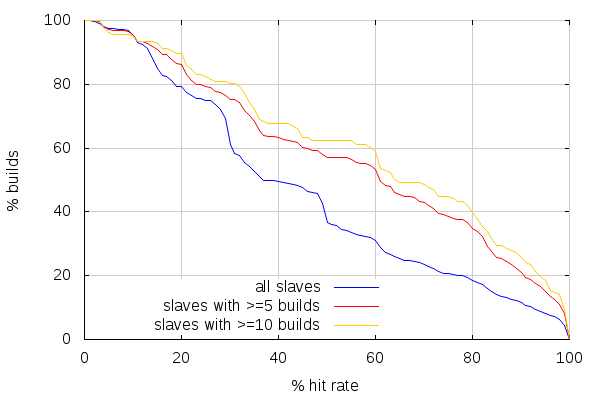
While the hit rates are better when looking at the slaves with more linux64 opt builds, they don't come close to mac hit rates. But this has to do with the fact that I merely removed results from slaves that only did a few builds. That didn't change how the builds were spread amongst slaves, and how more or less related those builds were in consequence: with fewer slaves to build on, slaves are more likely to build sources that look alike.
Interestingly, we can get a sense of how much builds done by a given slave are related by looking at direct mode cache hits.
The direct mode is a feature introduced in ccache 3 that avoids preprocessor calls by looking directly at sources files and their dependencies. When you have an empty cache, ccache will use the preprocessor as usual, but it will also store information about all the files that were used to preprocess the given source. That information, as well as the hash of the preprocessed source, is stored with a key corresponding, essentially, to a hash of the source file, unpreprocessed. So the next time the same source file is compiled, ccache will look at that dependency information (manifest), and check if all the dependent files are unchanged.
If they are, then it knows the hash of the preprocessed source without running the preprocessor, and can thus get the corresponding object file. If they aren't, then ccache runs the preprocessor, and does a lookup based on the preprocessed source. So the more direct mode cache hits there are compared to overall cache hits, the more slaves tended to build similar trees.
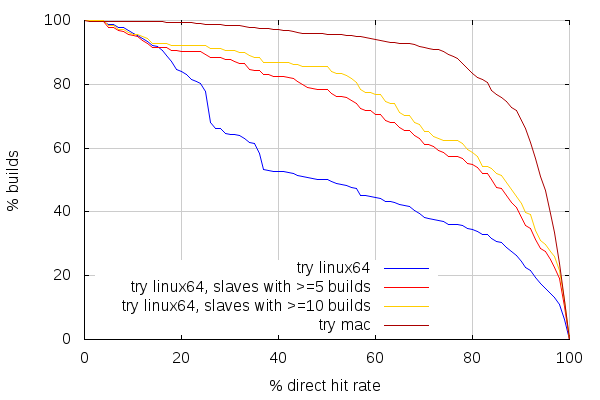
And again, looking at linux slaves with 5 or more builds, and 10 or more builds, shows the general trend that the more related builds a slave does, the more efficient the cache is (News at 11).
The problem is that we don't let them be efficient with the current pooling of slaves. Shared caching would conveniently wallpaper around that scheduling inefficiency. But the latency due to network access for the shared cache makes it necessary, for further build times improvements, to still have a local cache, which means we should still address that inefficiency.
Inbound builds
Inbound is, nowadays, the branch where most things happen. It is the most active landing branch, which makes it the place where most of future Firefox code lands first. Continuous integration of that branch relies on a different pool of build slaves than those used for try, but it uses the same pool of slaves as other project branches such as mozilla-central, b2g-inbound, fx-team, aurora, etc. or disposable branches. There are 573 linux slaves (like for try, not necessarily all running) and 63 mac slaves for all those branches.
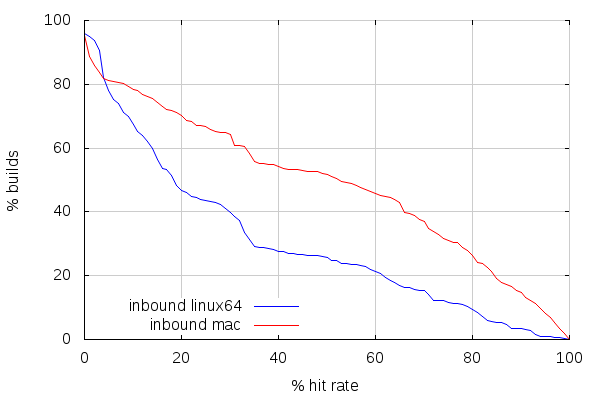
The first thing to realize here is that there are between 4 and 5% of those builds with absolutely no cache hit. I haven't researched why that is. Maybe we're starting with an empty cache on some slaves. Or maybe we recently landed something that invalidates the cache completely (build flags changes would tend to do that).
The second thing is that cache hit rate on inbound is lower than it is on try. Direct mode cache hit rates, below, show, however, a tendency for better similarity between builds than on try. Which is pretty much expected, considering inbound only takes incremental changes, compared to try, which takes random patch sets based on more or less randomly old mozilla-central changesets.
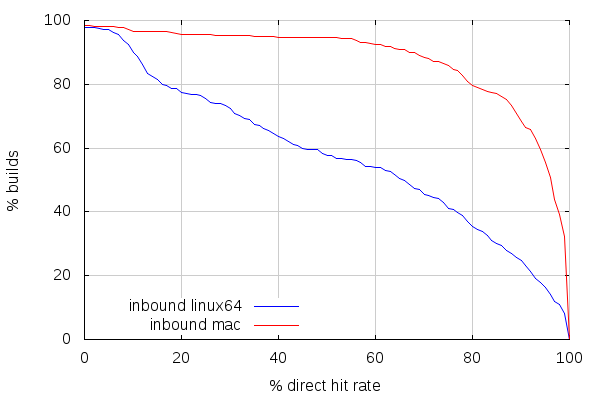
But here's the deal: builds are even more spread across slaves than on try.
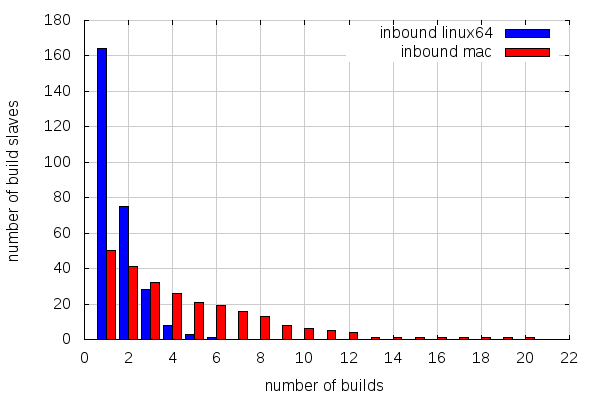
There are also less builds than on try overall, but there are more slaves involved in proportion (repeating the numbers for try for better comparison):
- 218 slaves for 587 builds on linux64 try (average: 2.7 builds per slave)
- 164 slaves for 279 builds on linux64 inbound (average: 1.7 builds per slave)
- 23 slaves for 563 builds on mac try (average; 24.5 builds per slave)
- 50 slaves for 249 builds on mac inbound (average: 5 builds per slave)
Contrary to try, where all builds start from scratch (clobber builds), builds for inbound may start from a previous build state from an older changeset. We sometimes force clobber builds on inbound, but the expectation is that most builds should not be clobber builds. The fact that so few builds run on a same slave over a period of 10 days undermines that and likely makes us mostly do near clobber builds all the time. But this will be the subject of next post. Stay tuned.
Note: CCACHE_BASEDIR makes things a bit more complicated, since the same slaves are used for various branches and CCACHE_BASEDIR might help getting better hit rates across branches, but since inbound is the place where most things land first, it shouldn't influence too much the above analysis.
Although, there is a concern that the number of different unrelated branches and different build types occurring on a same slave might be helping cache entries being evicted because the cache has a finite size. There are around 200k files in ccache on slaves, and a clobber build will fill about 8k. It only takes about 25 completely unrelated builds (think different build flags, etc.) to throw an older build's cache away. I haven't analyzed this part of the problem, but it surely influences cache hit rate in the wrong direction.
Anyways, for all these reasons, and again, while shared cache will wallpaper over it, we need to address the build scheduling inefficiencies somehow.
2014-01-31 10:56:39+0900
Responses are currently closed, but you can trackback from your own site.

2014-01-31 16:07:37+0900
Nice post!
I think it would be rad if we snapshotted topsrcdir and topobjdir as part of the build. When a slave goes to build X, it pulls the snapshot of the most recently built ancestor of X and does an incremental on that. This saving of snapshots also gets us the ability to download and reproduce builds and their results locally, especially if we’re able to reconstruct the chroot build environment. Goodbye unknown clobbers! Wins all around. Except perhaps the perf of creating, transferring, and applying snapshots. But modern filesystems should make this relatively painless.
Shared ccache will hopefully deliver snapshot-like results sooner, at a much lower cost. Snapshots can wait, methinks.