Archive for February, 2014

Analyzing shared cache on try

As mentioned in previous post, shared cache is now effective on try for linux and linux64, opt and debug builds, provided the push has changeset a62bde1d6efe in its history. The unknown in that equation was how long it takes for landings in mozilla-inbound or mozilla-central to propagate to try pushes.

So I took a period of about 8 days and observed, on a sliding 24-hours window, the percentage of pushes containing that changeset, and to see if the dev-tree-management post had an impact, I also looked at a random mozilla-central changeset, 339f0d450d46. This is what this looks like:
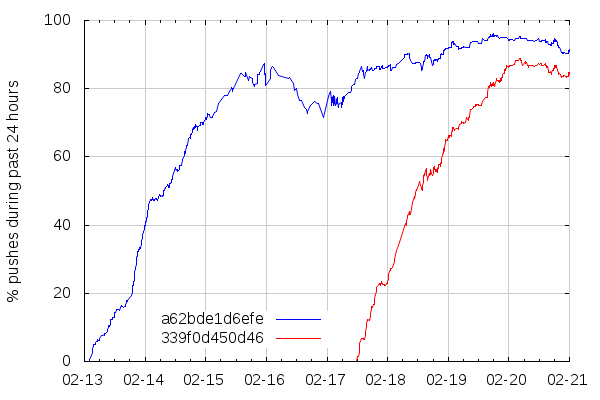
So it takes about 2 days and a half for a mozilla-central changeset to propagate to most try pushes, and it looks like my dev-tree-management post (which was cross-posted on dev-platform) didn't have an impact, although 339f0d450d46 is close enough to the announcement that it could still be benefitting from it. I'll revisit this with future unannounced changes.

The drop that can be seen on February 16 is due to there being less overall pushes over the week-end, and that somehow made pushes without changeset a62bde1d6efe more prominent. Maybe contributors pushing on the week-end are more likely to push old trees.

Now, let's see what effect shared cache had on try build times. I took about the last two weeks of successful try build logs for linux and linux64, opt and debug, and analyzed them to extract the following data:

  • Where they were built (in-house vs AWS),
  • Whether they were built with unified sources or not (this significantly changes build times),
  • Whether they used the shared cache or not,
  • Whether they are PGO builds or not,
  • How long the "compile" step took (which, really, is "make -f client.mk", so this includes more than compilation, like configure and copying many files),

There sadly weren't enough PGO builds to plot anything about them, so I just excluded them. Then, since the shared cache is only enabled on AWS builds, and since AWS and in-house build times are so different, I excluded in-house builds. Further looking at the build times for linux opt, linux64 opt, linux debug and linux64 debug, they all looked similar enough that they didn't need to be split in different buckets.

Update: I should mention that I also excluded my own try pushes because I tended to do multiple rebuilds on them, with all of them getting near 100% cache hit and best build times.

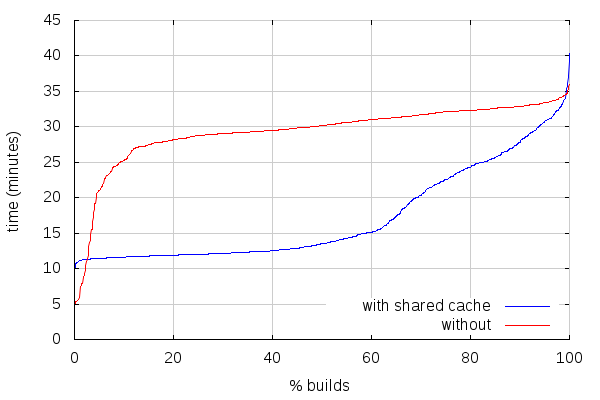
Sorting all that data by build time, the following are graphs showing how many builds took less than a given build time.

For unified sources builds (870 builds with ccache, 1111 builds with shared cache):
For non-unified sources builds (302 builds with ccache, 332 builds with shared cache):
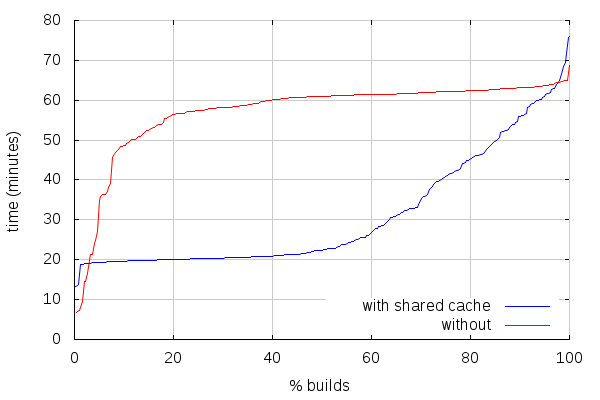
The first thing to note is that this does include the very first try pushes with shared cache, which probably skews the slowest builds. It should also be noted that linux debug builds are (still) currently non-unified by default for some reason.

With that being said, for unified sources builds, there are about 3.25% of the builds that end up slower with shared cache than with ccache, and 5.2% for non-unified builds. Most of that is on the best build times end, where builds with shared cache can spend twice the time we'd spend with ccache. I'm currently working on changes that should make the difference slimmer (more on that in a subsequent post). Anyways, that still leaves more than 90% builds faster with shared cache, and makes for a big improvement in build times on average:

Unified Non-unified
shared ccache shared ccache
Average 17:11 29:19 30:58 57:08
Median 13:30 30:10 22:27 60:57

Interestingly, a few of the fastest non-unified builds with shared cache were significantly faster than the others, and it looks like what they have in common is that they were built on the US-East-1 region, instead of US-West-2 region. I haven't looked into more details as to why those particular builds were much faster.

2014-02-25 03:57:20+0900
p.m.o | 1 Comment »

Testing shared cache on try

After some success with the shared cache experiment (Read about it, and some more), the next step was to get it to work on the Mozilla continuous integration infrastructure, and it turned out to reveal a couple issues.

The first issue is that the DNS server for the AWS build slaves we use is not the AWS DNS, but our in-house DNS. Which has two consequences:

  • whatever geolocation S3 does at the DNS level may end up giving a S3 endpoint IP that is not optimal for the AWS region we're in because it was correlated to the location of our in-house DNS
  • the roundtrip to the in-house DNS server was around 80ms, and because every compilation is an independent process, each one does a DNS request, so each one gets that 80ms hit. Note that while suboptimal, doing a DNS request for each compilation also allows to get different S3 endpoints because of both DNS round robin and geolocation S3 uses, which gives very different IPs every so often.

The consequence of this is that build times were very unstable, ranging from 11 minutes like during my experiments up to 45 minutes for a 99% cache hit build! After importing a DNS resolver in the shared cache script and making it use the AWS DNS, build times became much more stable between 11 and 12 minutes. (we actually do need to use the in-house DNS for normal operations on the build slaves, so it's not possible to switch /etc/resolv.conf)

The second issue is that the US Standard region for S3 can have quite high latency depending on the region you're connecting to it from. Our build slaves are located in Oregon and Northern Virginia, and while the slaves in Northern Virginia could reach S3 US Standard within 3ms, those in Oregon could only reach it within 90ms. Those numbers were unfortunately gotten with the in-house DNS, so geolocation may have had its impact on them, but after switching DNS, the build times on Oregon slaves were still way higher than on Northern Virginia slaves (~11 minutes vs. ~21 minutes). Which led us to use a S3 bucket per region.

With those issues dealt with, we're now ready for more widespread testing, and as such I've turned the shared cache on on Linux opt, Linux debug, Linux64 opt and Linux64 debug builds, for try only, only if the push contains the relevant setup, which landed in changeset a62bde1d6efe.
See my post on dev-tree-management for a few more details, notably if you hit bugs.

Please note this is only the beginning. More platforms will use the cache soon, including some that aren't currently using ccache. And I got some timing numbers during the initial tests on try that hint at the most immediate performance issues with the script that need addressing. So you can expect builds to get faster and faster as the cache populates, and as the script is improved with feedback from past experiments and current deployment (I'll be collecting data from your try pushes). Also relatedly, I'm working on build system improvements that should make the 'libs' step much faster, cutting down the time spent on that step.

2014-02-13 10:18:45+0900

p.m.o | No Comments »

Efficiency of incremental builds on inbound

Contrary to try, most other branches, like inbound, don't start builds from an empty tree. They start from the result of the previous build for the same branch on the same slave. But sometimes that doesn't work well, so we need to clobber (which means we remove the old build tree and start from scratch again). When that happens, we usually trigger a clobber on all subsequent builds for the branch. Or sometimes we just declare a slave too old and do a periodic clobber. Or sometimes a slave just doesn't have a previous build tree.

As I mentioned in the previous post about ccache efficiency, the fact that so many builds run on different slaves may hinder those incremental builds. Let's get numbers.

Taking the same sample of builds as before (spanning across 10 days after the holidays), I gathered some numbers for linux64 opt and macosx64 opt builds, based on the number of files ccache built: when starting from a previous build, ccache is not invoked as much (or so would we like), and that shows up in its stats.

The sample is 408 pushes, including a total of 1454 changesets. Of those pushes:

  • 344 had a linux64 opt build, 2 of which were retriggered because of a failure, for a total of 346 builds
  • 377 had a macosx64 opt build, 12 of which were retriggered because of a failure, and 6 more were retriggered for some other reason, for a total of 397 builds. This doesn't line up because 2 pushes had their build retriggered twice.

It's interesting to see how many builds we actually skip, most probably because of coalescing. I'd argue this is too many, but I haven't looked exactly how many of those are legitimate "no need to build this because it is android only" or similar patterns.

Armed with an AWS linux builder, I replayed those 408 pushes in an optimal setup: no clobber besides those requested by the build system itself, all pushes built on the same machine, in the order they land. I however didn't skip builds like the actual slaves do, but this really doesn't matter anyways since they are not building consecutive pushes anyways. Note configure was rerun for every push because of how my builder handles pulling from mercurial. We don't do that on build slaves but I'd argue we should, it would avoid plenty of build system level clobbers, and many "fun" build failures.

Of those 408 pushes, 6 requested a clobber at the build system level. But the numbers are very different on build slaves:

  • On linux, out of 346 builds:
    • 19 had a clobber by the build system
    • 8 had a forced clobber (when using the clobberer)
    • 1 had a periodic clobber
    • 162 (!) had no previous build tree at all for whatever reason (purged previously, or new slave)
    • for a total of 190 builds ending up starting with no previous build tree (54.9%)
  • On mac, out of 397 builds:
    • 23 had a clobber by the build system
    • 31 had a forced clobber
    • 34 had no previous build tree at all
    • for a total of 88 builds with no previous build tree (22.2%)

(Note the difference in numbers of build system clobbers and forced clobbers is due to them being masked by the lack of previous build tree on linux)

Like for ccache efficiency, the use of a bigger build slave pool for linux builds is hurting and making them start from scratch more often than not, which doesn't help with the build turnaround times.

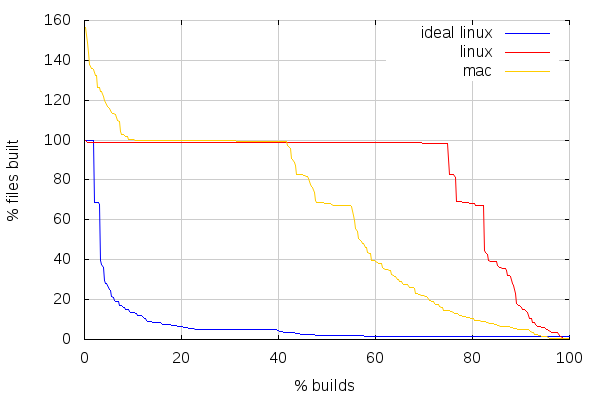
But even on the remaining non-clobber builds, if the source tree is significantly different, we may end up rebuilding as much as if we had clobbered in the first place. Sometimes it only takes a change to one file to do that (for example, add an AC_DEFINE in configure.in, and it will rebuild almost everything), but sometimes it can be an accumulation of changes. This is where the ccache stats get useful again.

A few preliminary observations:

  • There are always at least around 1.5% files rebuilt on ideal linux builds (which needs investigating), but a lot of the builds rebuilt around 5% because of bug 959519
  • The number of source files can vary across pushes, but I used a more or less appropriate constant value for all builds, so some near 100% values may actually be 100%
  • Mac builds surprisingly sometimes build the same files more than once. I filed bug 967976

The first thing to note on the above graph is that about 42% of mac builds and about 75% of linux builds are either clobbers or near-clobbers as I like to call them (incremental builds that just rebuild everything). Near-clobbers thus count for as many as 20% of overall builds on both platforms, or about 50% (!) of non-clobber builds on linux and about 25% of non-clobber builds on mac.

I can't stress enough how the build slave pool sizes are hurting our turnaround times.

It can be noted that there are a few plateaus around 82% and 69% files built, which are likely due to central headers being changed and triggering that many files to be rebuilt. This is the kind of thing that efforts like using include-what-you-use helps with, and we've made progress on that in the past months.

Overall, with our current setup, we are in a vicious circle. Adding more build types (like recently ASAN, Root analysis, Valgrind, etc.), or landing more stuff requires more slaves. More slaves makes builds slower for reasons given here and in previous posts. Slower builds require more slaves to keep up with landings. Rinse, repeat. We need to break the feedback loop.

(Fun fact: While I haven't been doing more than mercurial updates and building the tree to gather the ideal linux numbers (so no make package, no make check, etc.), it only took about a day. For 10 days worth of inbound pushes. With one machine)

2014-02-05 03:57:49+0900

p.m.o | 2 Comments »